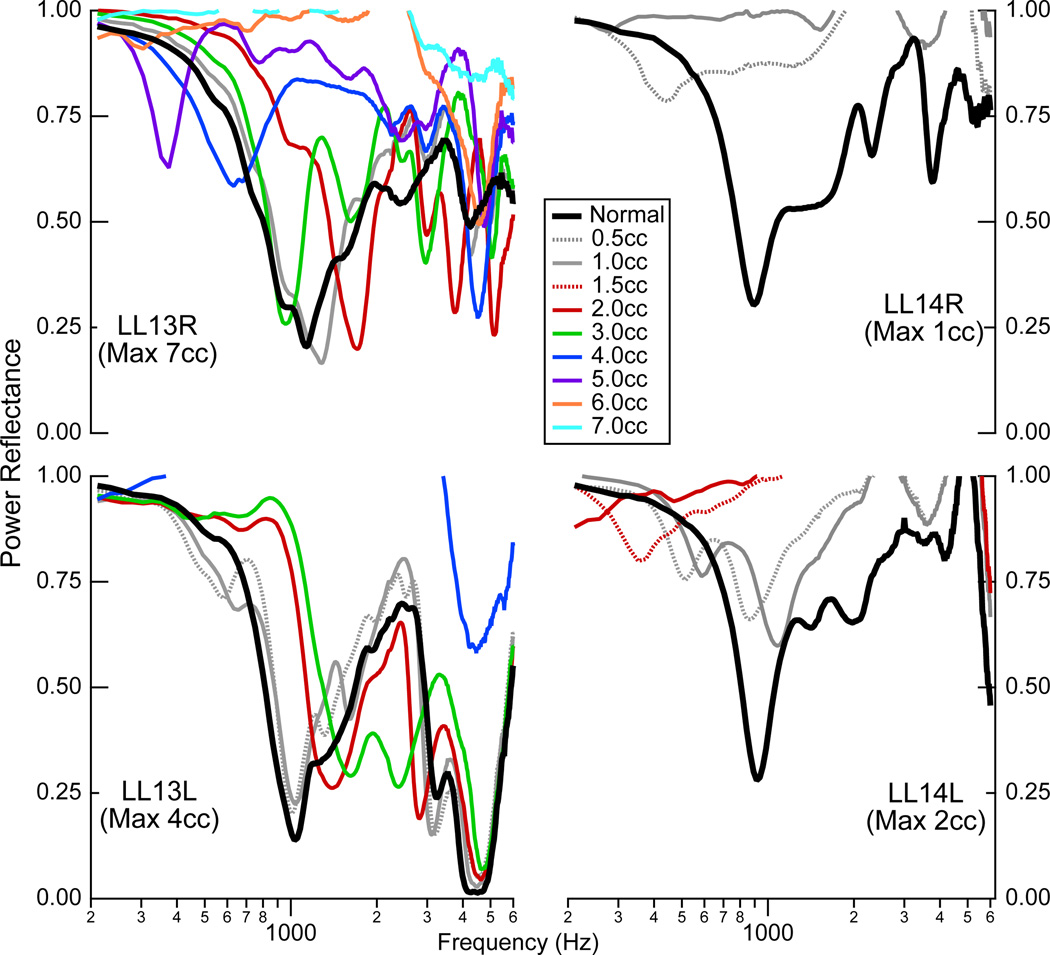
Figure 6.
Power reflectance on four ears with calibrated amounts of saline in the middle ear. Measurements were made in the normal state, and then with increasing amounts of saline added in 0.5 cc increments; in some cases, measurements are only plotted for 1cc increments in order to increase visibility within the graph. Measurements stopped when the middle-ear cavity appeared full of saline, with saline leaking out of the vent tube in the mastoid cavity.

