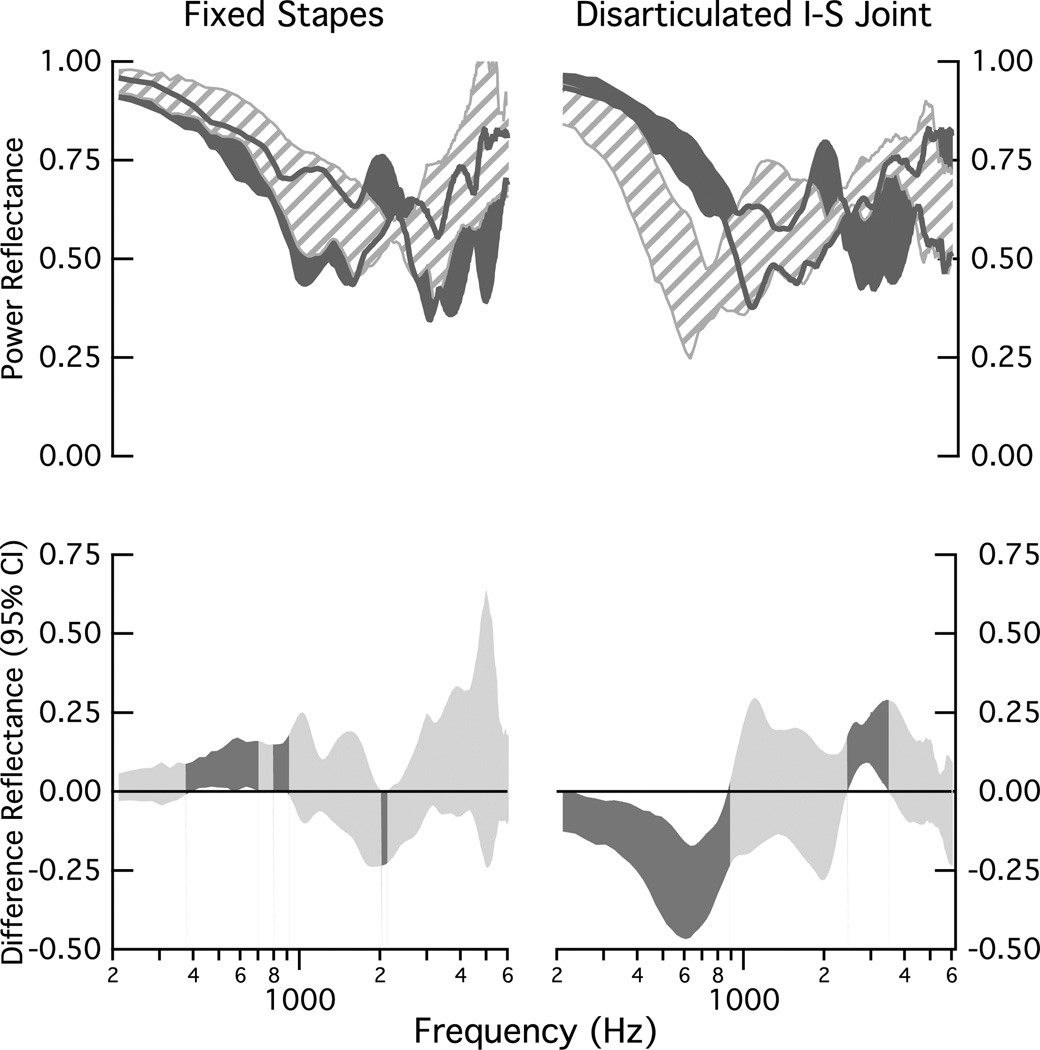
Figure 8.
Comparisons of population measurements of power reflectance ℛ under normal conditions and with stapes fixation (left) and incus-stapes (I-S) disarticulation (right) manipulations. Upper: All shaded regions represent the 25 to 75% range of data collected on the eight ears. The dark gray indicates the range for the ears in the normal condition and the striped area indicates the range for the manipulation. The dark gray lines indicate the edges of the shaded region for the normal ears. Lower: Ninety-five percent confidence intervals computed for the mean of the difference between the eight matched measurements that define the upper plots; dark shaded areas indicate regions where the mean difference differs from zero (ρ < 0.05) and lighter shaded areas indicate no difference from zero (ρ ≥ 0.05).

