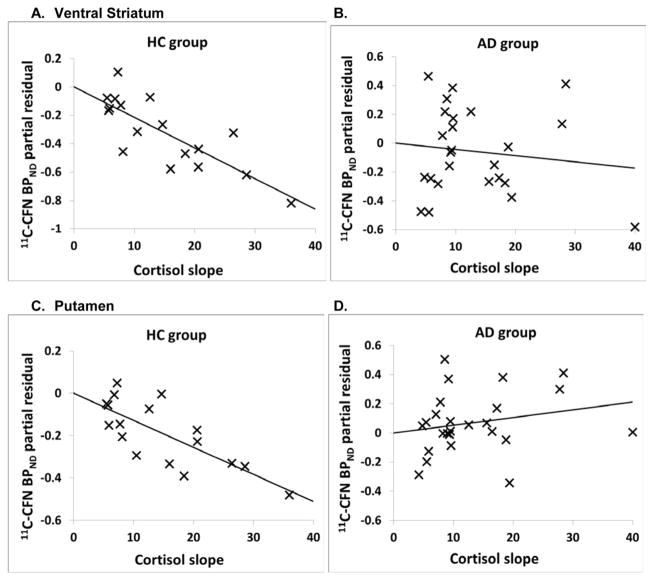
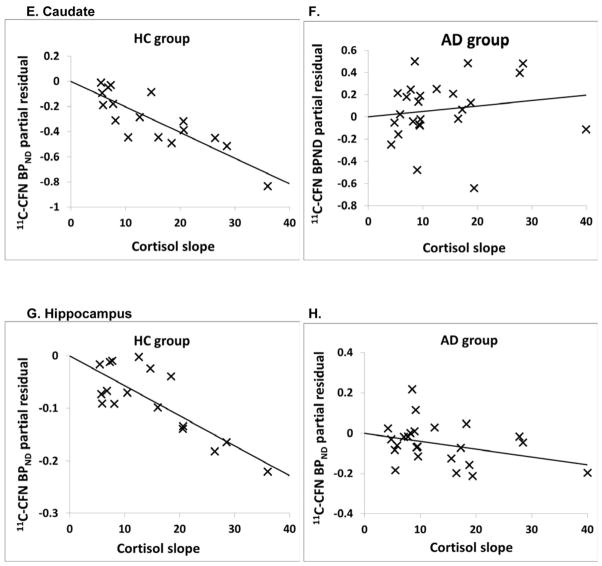
Figure 2.
Partial residual plots of [11C]CFN BPND and cortisol slope response adjusted for sex and smoking (for regression in table 3). Statistics are displayed in Table 4. A and B: ventral striatum; C and D: putamen; E and F: caudate; G and H: hippocampus.


