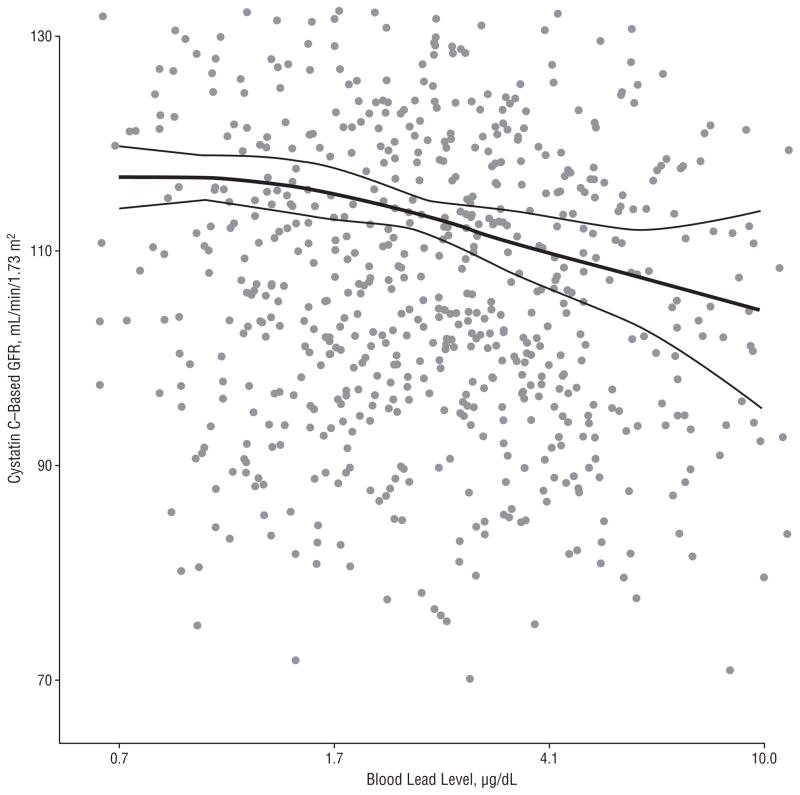
Figure.
Cystatin C–estimated glomerular filtration rate (GFR) by blood lead levels. The thick line represents estimated GFR based on restricted quadratic splines transformation for log-transformed blood lead levels (restricted to ≤10 μg/dL [to convert to micromoles per liter, multiply by 0.0483]) with knots at the 10th, 50th, and 90th percentiles. Thin lines represent corresponding 95% confidence intervals. Data points for the scatterplot represent adjusted blood lead and estimated GFR values and were calculated as the residuals from the weighted linear regression models of log-lead and estimated GFR on the covariates used in model 3 in Table 2. Mean log-lead and estimated GFR levels were added to the residuals to facilitate interpretation of the scatterplot. The horizontal axis is in log scale.

