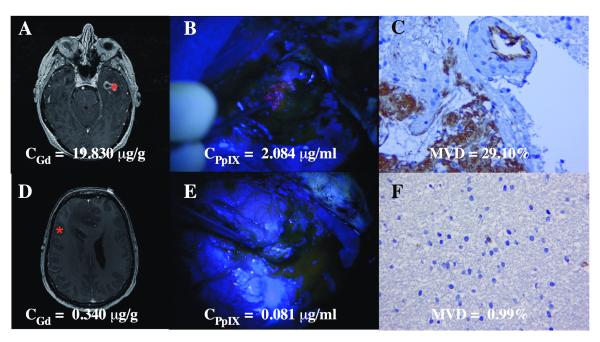
Figure 5.
Contrast-enhanced T1-weighted magnetic resonance (MR) imaging relationships with protoporphyrin IX (PpIX) concentrations, gadolinium concentrations, and microvascular density (MVD). Median and interquartiles ranges of CPpIX (A), CGd (B) and MVD (C) in non-enhancing, [(−) GdE], or enhancing, [(+) GdE] tissue on post-contrast injection T1-weighted MR imaging. Wilcoxon-rank sum (Mann-Whitney) tests were used to determine significant differences between groups. A clustered data analysis of variance was performed to validate these results and to account for multiple samples for each patient: CPpIX (p = 0.0013), CGd (p < 0.0001), and MVD (p < 0.0001) were all significantly higher in (+) GdE vs. (−) GdE tissue. CGd, gadolinium concentration; CPpIX = ;protoporphyrin IX concentration; MVD, microvascular density.

