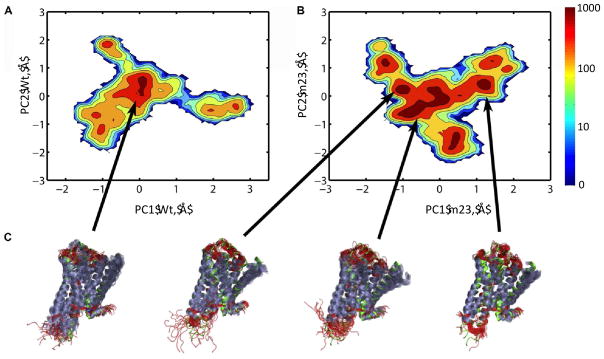
Figure 1.

Comparison of the major motions observed in MD simulations of wt-β1AR and thermostabilized m23-β1AR. Conformational clusters, based on PC coordinates, were calculated from the MD simulations and are represented in 2-dimensions, projected on their respective principal components, PC1 and PC2: A. wt-β1AR and B. the m23-β1AR. Densely populated regions are colored in red, while sparsely populated regions are shown in deep blue. C. Representative ensemble of structures from each conformational cluster are depicted in cartoon representation (α-helices purple, non-helical regions red) aligned with the crystal structure of m23-β1AR (green, pdb: 2Y04).
