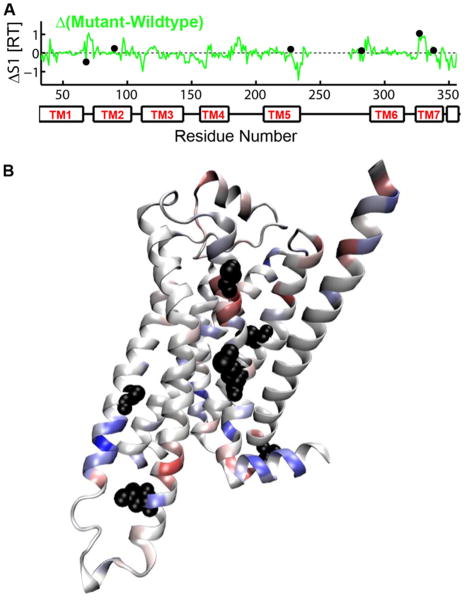
Figure 3.
The difference in the first order entropy (ΔS1) for each amino acid in m23-β1AR and wt-β1AR. A. ΔS1 plotted against the position in the amino acid sequence. Filled black circles show the location of the 6 thermostabilizing mutations in m23-β1AR. B. The difference in first order entropy between wt-β1AR and m23-β1AR is depicted on a cartoon of the m23-β1AR structure: regions in blue have lower entropy in m23-β1AR compared to wt-β1AR, while regions in red have higher entropy. The side chains of thermostabilizing residues are shown as black spheres.

