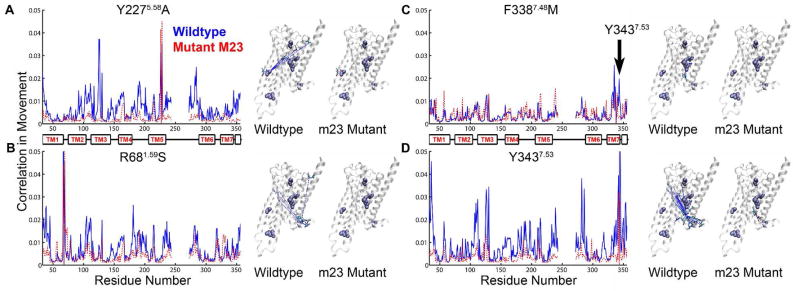
Figure 4.

Calculated correlated movement of thermostabilizing residues with all the residues in the receptor. Each graph shows the calculated correlation in movement versus the amino acid number for both wt-β1AR (solid blue line) and the thermostable mutant m23-β1AR (dashed red line). Associated to the right of each graph are two cartoons of the β1AR structure showing the side chains of thermostabilizing amino acid residues (space filling models, purple) and amino acid residues that show correlated movement (sticks; C, cyan; O, red; N, blue). In each figure, dashed lines link the Cα atom of the thermostabilizing mutation with the amino acid residue showing correlated movement: wt-β1AR, blue; m23-β1AR, red. Both A. the Y227A and B. R68S thermostabilizing mutations reduce correlated movement between the thermostabilizing residue and many residues throughout the receptor. C. The major effect of the F338M mutation is to cause a loss in correlated movement between the residue and Y3437.53. D. The residue Y3437.53, which is affected by the neighboring mutation F338M, shows reduced correlated movement to many residues in the receptor.
