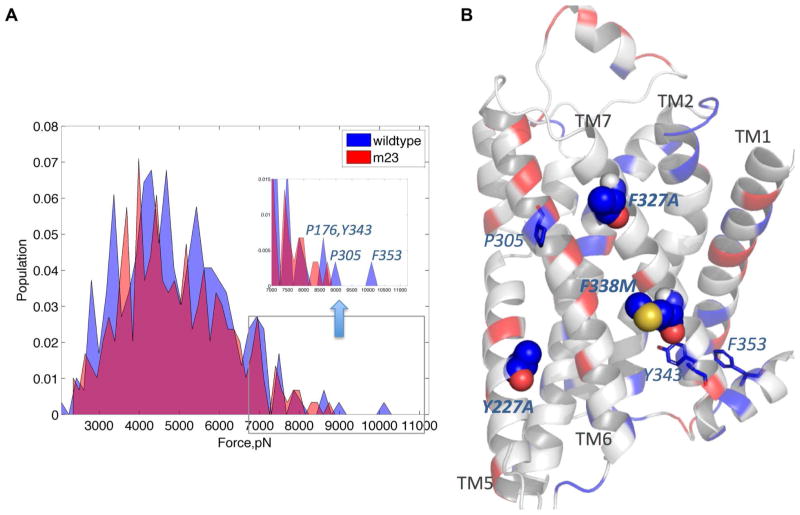
Figure 6.
A. Comparison of population density distribution of forces calculated on each residue. Forces are calculated by taking averages within 3 Å of each residue position, including both bonded and non-bonded force components; Populations (proportion of residues within each force range) are plotted with respect to the calculated force; wt-β1AR, blue; m23-β1AR, red; overlap, magenta. Regions of high stress in the wt-β1AR are shown in the inset and the residues that contribute most to the peaks with high force values are shown. B. Differences in forces calculated between m23-β1AR and wt-β1AR are depicted on the structure of m23-β1AR. Regions that show a change in force of more than 10 pN are highlighted. Regions of increased inter-residue forces in m23-β1AR compared to wt-β1AR, are shown in red and decreased stress are in blue. The thermostabilizing residues that show major stress reduction are shown as spheres and the other residues with significantly lower stress are shown as sticks.

