
Figure 1.
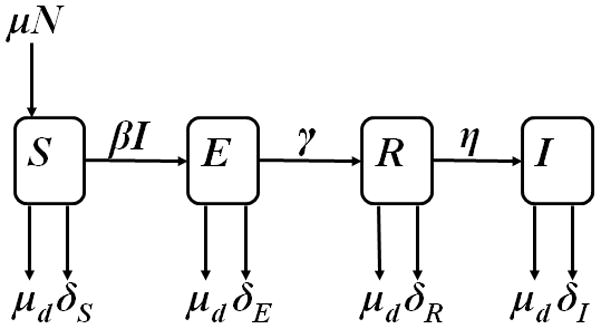
Schematic diagram of the full state-transition model for dynamics of the spread of Mycobacterium bovis infection in a theoretical US cattle herd. Animals susceptible to M bovis infection (S) enter a herd of size N at a replacement rate of μ, become latently infected at rate βI through contact with cattle shedding M bovis (termed infectious [I]). Latently infected cattle (E) become noninfectious, test-positive reactors (R) at rate γ, which become infectious at rate η. Cattle in each category k are removed on the basis of CFT and CCT results at rate δk, which is based on the testing interval as well as sensitivity and specificity of the skin tests. From all categories, cattle are culled (or die for any reason) at a general rate μd.