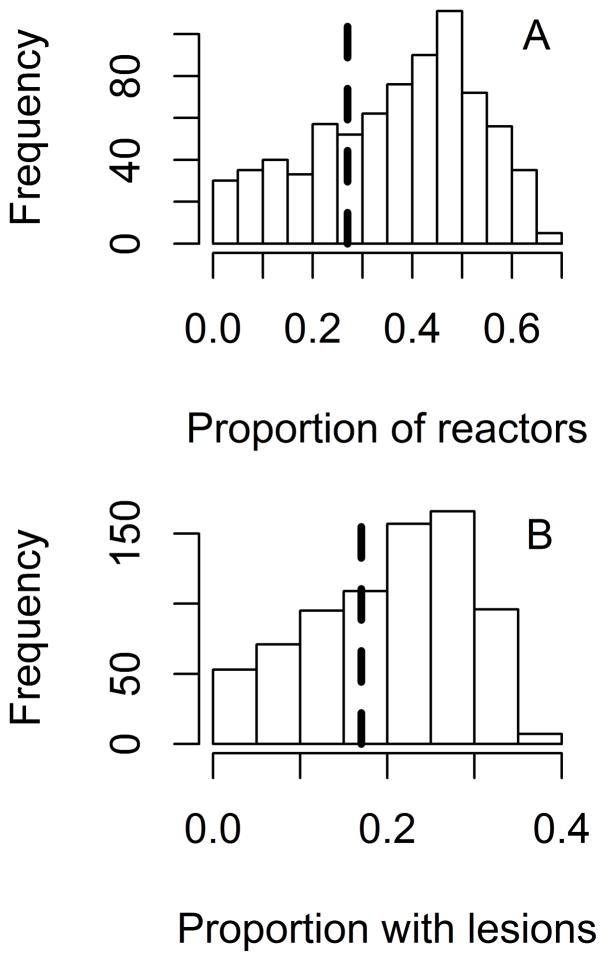
Figure 4.
Bar graphs showing predicted and observed prevalence of test results during an outbreak of bovine tuberculosis in a single 331-head herd of beef cattle, in which M bovis was detected 15 years after probable disease introduction.16 The analysis was used for validation of a base model created to predict various outcomes in theoretical cattle herds following introduction of 1 latently infected animal. A—Proportion of cattle with positive CCT results (ie, reactors). B—Proportion of reactors that had lesions detected at slaughter. Bars indicate predicted values, and dashed vertical lines indicate observed values.

