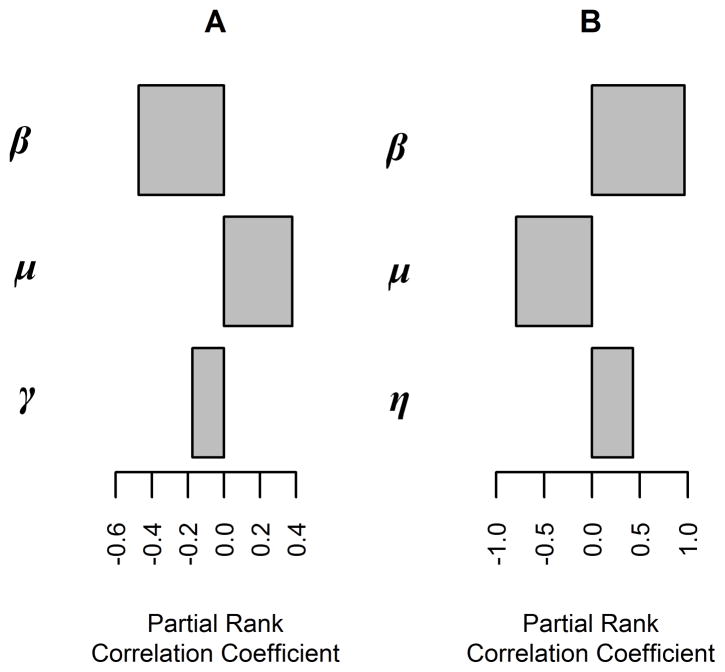
Figure 5.
Tornado graphs generated via global sensitivity analysis of the base model for within-herd spread of bovine tuberculosis in large (3,000 head) cattle herds with high replacement rates (0.33 cows/y). Partial rank correlation coefficient values for variables significantly associated with the probability of fadeout (A) and the mean number of cattle infected (B) are shown. β = Effective contact rate of M bovis infection. See Figure 1 for remainder of key.

