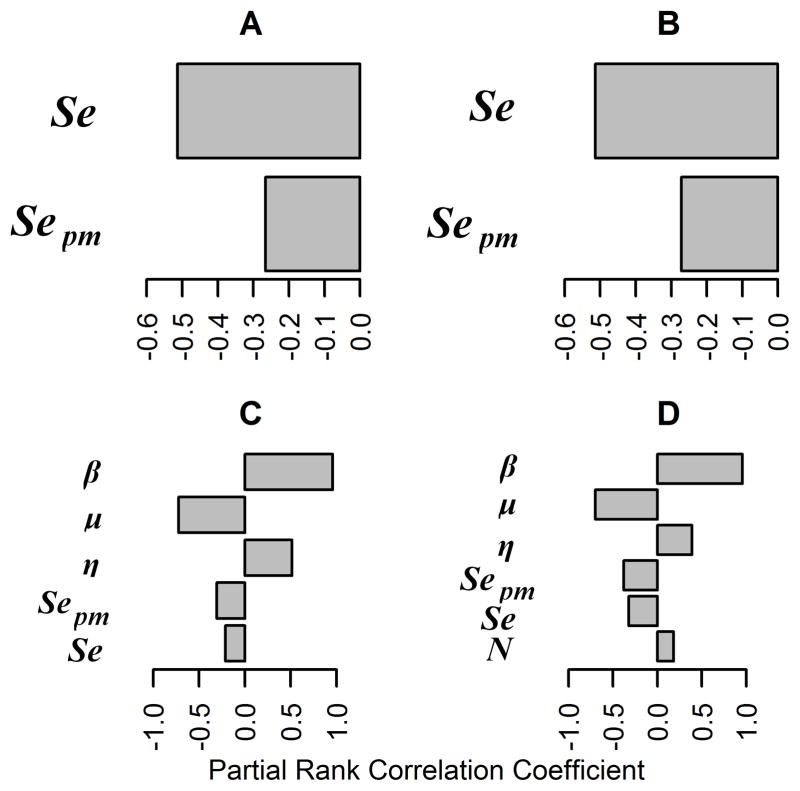
Figure 6.
Tornado graphs generated via global sensitivity analysis of the slaughterhouse-detection based testing and test-based culling strategy model for within-herd spread of bovine tuberculosis in the same theoretical cattle herds as in Figure 2. Partial rank correlation coefficient values for variables significantly associated with the mean (A) and SD (B) of time to fadeout and mean (C) and SD (D) number of cattle infected are shown. Se = Combined sensitivity of the CFT and CCT. Sepm = Sensitivity of detection of M bovis infection via slaughterhouse surveillance. See Figures 1 and 5 for remainder of key.

