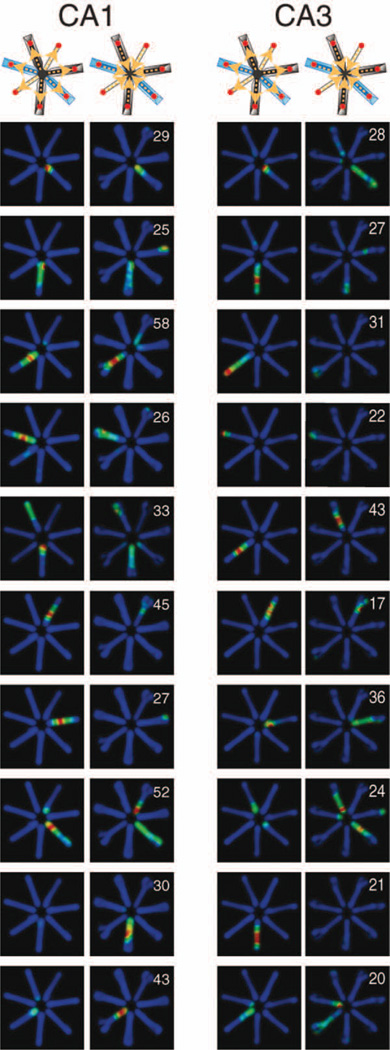
FIGURE 8.
Example place cells in the radial arm maze. Heatmaps show position-related firing rates of representative CA1 and CA3 pyramidal neurons. Numbers indicate peak firing rates (Hz). Top: layout of the maze with different arms. Arrows indicate travel direction of the rat. [Color figure can be viewed in the online issue, which is available at wileyonlinelibrary.com.]

