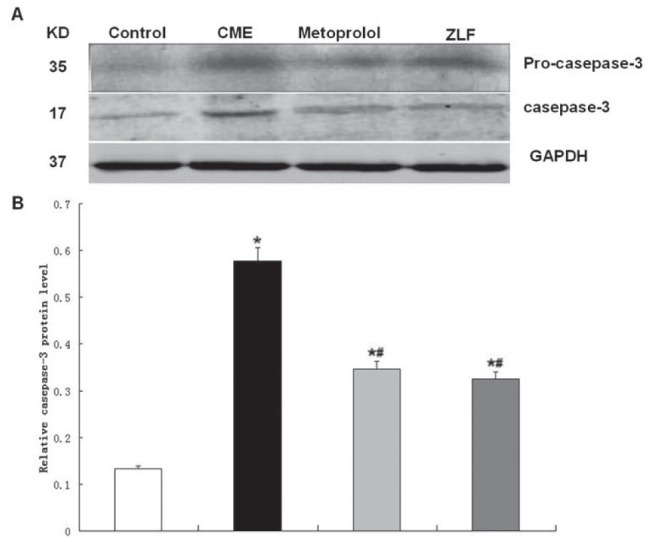
Figure 5).

Effect of metoprolol on caspase-3 expression following coronary microembolization (CME). A The relative protein levels of procaspase-3 and activated caspase-3 were determined using Western blots (normalized to glyceraldehyde-3-phosphate dehydrogenase [GAPDH]). Lanes 1, 2, 3 and 4 in the representative gel show caspase-3 expression in control, CME (after 6 h), metoprolol and Z-LEHD-FMK (ZLF) groups, respectively. B The graphed data (n=10 per group) represent mean ± SD. *P<0.05 compared with the control group; #P<0.05 compared with the CME group
