Abstract
BACKGROUND:
The authors previously reported a murine model of left ventricular hypertrophy (LVH) and regression using a suture technique of transverse aortic arch constriction and subsequent removal. A number of issues have limited the widespread adoption of this method. The present study assessed a modification of this model using a titanium clip.
METHODS:
Male C57BL/6 mice (n=95) underwent minimally invasive aortic banding for three, four or six weeks with or without subsequent band removal for one week. Hearts were evaluated both structurally and functionally using heart weight/body weight ratios, transthoracic echocardiography and direct left ventricular pressure measured using catheterization.
RESULTS:
Clip banding resulted in a threefold gradient across the transverse aortic arch. Pressure overload induced concentric LVH by three weeks that progressively decompensated. By six weeks, hearts were significantly dilated, with poor left ventricular function. Clips were removed in a minimally invasive procedure after each time point. When overloaded for either three or four weeks, removal of the clip with subsequent pressure relief enabled regression of LVH and restoration of function. When removed after six weeks of banding, mouse hearts were unable to reverse remodel and maintained elevated left ventricular end-diastolic pressures and lung congestion.
CONCLUSIONS:
The application and removal of a titanium clip successfully induced pressure overload and relief associated with the serial development and reversal of LVH. Compared with similar models using suture ligation and release, this method was found to be a simple, effective (no slipped bands) and reproducible method to study murine LVH, heart failure and its regression.
Keywords: Animal model, Heart failure, Left ventricular hypertrophy, Reverse remodelling
Transverse aortic constriction is an experimental procedure commonly used in rodents to create pressure overload, left ventricular hypertrophy (LVH) and heart failure. Techniques to perform this procedure have evolved from opening the chest to minimally invasive transcervical approaches (1,2). We have previously modified the transverse aortic constriction procedure to include subsequent removal of the constricting band to enable the study of LVH regression and reverse remodelling (3,4). Since our original description, which used a slip-knot suture for constriction, we have noticed several issues. First, the act of tying the suture around the friable mouse aorta can be challenging to perform reproducibly. Second, the subsequent inflammation around the aorta encumbers easy removal of the previously placed suture. Finally, the slip-knot is subject to loosening, thus making the pressure overload less reliable. As a result of these observations, we have adopted a new technique using a titanium clip. Herein, we describe our experience with what we believe to be a highly reproducible, minimally invasive method for studying reverse remodelling.
METHODS
In accordance with an institutionally approved Institutional Animal Care and Use Committee protocol, minimally invasive transverse aortic arch banding and debanding was performed in 95 eight- to 10-week-old male mice weighing 20 g to 30 g (Charles River Laboratories, USA). Experimental groups were similar to those previously described (5): sham, aortic banding (AB) for either three, four or six weeks, and debanding (DB) after either three, four or six weeks of aortic constriction.
Surgical procedure
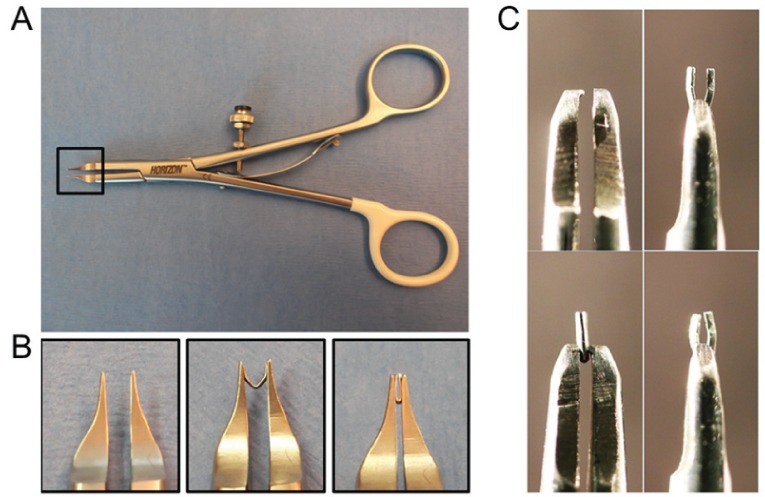
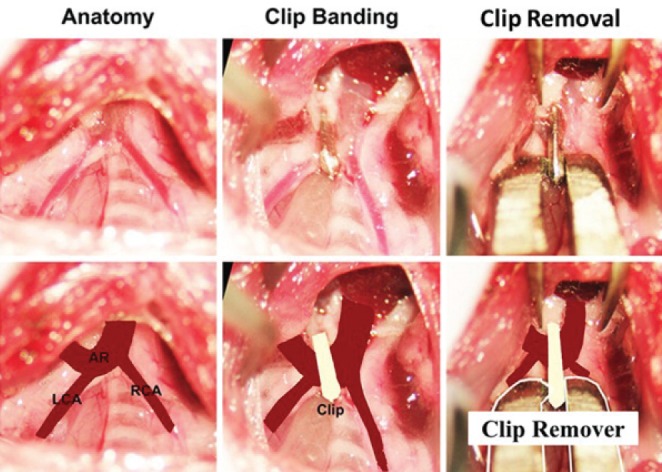
Mice were anesthetized with a single intraperitoneal injection of ketamine (100 mg/kg) and xylazine (10 mg/kg). A minimally invasive technique was used to approach and visualize the aortic arch, left carotid artery and innominate artery without opening the thoracic cavity, as previously described (3,4,6,7). Briefly, the skin was opened through a longitudinal incision at the level of the suprasternal notch with 0.5 cm extension proximally and distally. A 2 mm to 3 mm longitudinal cut was made in the proximal portion of the sternum after thyroid retraction following midline pretracheal muscle division. Tension sutures were passed through the pretracheal and pectoral muscle on each side, allowing visualization of the aortic arch, left carotid artery and innominate artery. A microclip applicator (Figure 1) was calibrated by dialing the tension on the ‘wheel’ of the applicator around a 27-gauge needle (Becton Dickinson, USA). Ultimately, the desired tension allowed the applicator to be physically lifted by the 27-gauge needle. If it was too loose, the applicator would fall off. This method allowed for identical tension on closure for every mouse. The sterile titianium clip (Hemoclip Plus, Weck Closure Systems, USA) was loaded into the applicator and placed across the aortic arch between the origin of the left carotid and innominate arteries, aided by a dissecting microscope (Figure 2). Muscle layers and skin were closed after placement of the clip. Carotid Doppler velocity recordings were taken to confirm appropriate gradients across the arch immediately after clip placement. The sham procedure was identical, including aortic dissection without clip placement.
Figure 1).

Instruments for aortic banding and debanding with a titanium clip. A The clip applier is calibrated by adjusting a scroll at the handle around a 27-gauge needle, resulting in the same dimension of constriction for every clip placement. B Detailed view of the clip applicator tip. C The clip remover is modified with a tapered tooth at the end of needle holder that squeeze the previously placed clip at a 90° angle to that of insertion, allowing it to be opened and removed. Panel 1 and 2: remover and grasping of clip; Panels 3 and 4: 90° view of grasping and opening of the previously closed clip
Figure 2).

Aortic banding and debanding with titanium clip. Surgical images viewed cephalad-caudad illustrating the placement and removal of the titanium clip. AR Aortic arch; LCA Left carotid artery; RCA Right carotid artery
After banding for three, four or six weeks (times previously identified during the progression phase of LVH and heart failure [HF]), clips were removed via the same approach used for clip placement. Mice were similarly anesthetized and the previous incision was reopened to expose the clip. A fine-tipped needle driver was then used to grab the clip perpendicularly to the plane in which it was placed. The clip remover was modified from a micro needle holder (Halsey micro needle holder, 12500-12, Fine Science Tools, USA) with one side of the tip machine modified with a diamond-shaped tooth to assist clip opening. By squeezing the clip in this plane, the clip opens, enabling its subsequent removal (Figure 1C). Of the 95 mice studied, eight died during or after AB surgery and three mice died during DB.
Echocardiography
Transthoracic echocardiography was performed using a Vivid 5 (General Electric, USA) system equipped with a linear 15 MHz transducer. Mice were anesthetized with 1% to 1.5% inhaled isoflurane. Depth of anesthesia was standardized by recording images at a heart rate of 580 beats/min to 520 beats/min. Images were obtained before surgery and after the respective timepoints. Ventricular dimensions, wall thickness and ejection fraction were recorded and calculated using M-mode parasternal long and short axis views, while carotid artery peak blood flow velocities were determined by pulsed-wave Doppler echocardiography.
Left ventricular pressure measurements
Left ventricular hemodynamics were assessed at each time point before necropsy using a closed chest technique (8). In brief, the right carotid artery was catheterized with a 1.0 Fr Millar Catheter PVR-1045 (Millar Instruments, USA) and pressure was recorded using LabVIEW 7.1 software (National Instruments, USA).
Statistics
Ratios of heart weight and lung weight to body weight were analyzed using one-way ANOVAs. Doppler gradients and echocardiographic measurements were analyzed using two-tailed paired t tests. Data are presented as mean ± SEM. P<0.05 was considered to be statistically significant.
RESULTS
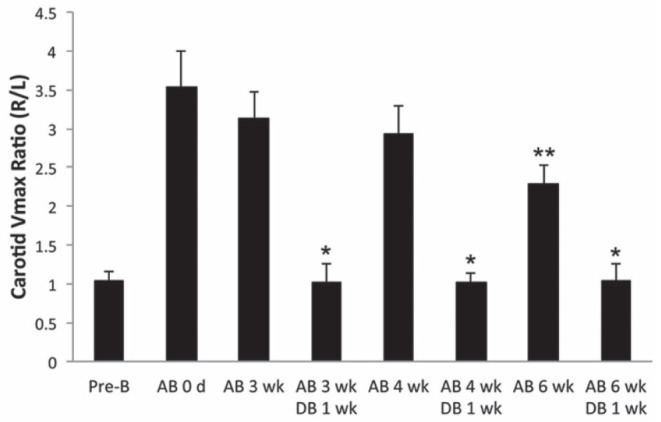
As expected, placement of the constricting clip reproducibly created a three- to fourfold gradient across the aortic arch as measured between right and left carotid peak velocities (Figure 3). Importantly, this gradient was maintained throughout the experimental period. After six weeks of AB, the gradient decreased, which most likely represents the decreased contractility associated with the failing heart. Furthermore, removal of the clip resulted in normalization of the arch pressure gradient, reflecting the reversible nature of aortic constriction with the titanium clip.
Figure 3).

Carotid Doppler velocities measurements were performed pre-banding, immediately postbanding and at the respective serial time points. Gradients are depicted as the ratio of right versus left maximum velocities. *P<0.05 versus aortic banding (AB) at the respective timepoint, **P<0.05 versus AB at zero, three and four weeks. DB Debanding; L Left carotid artery; R Right carotid artery; VMax Peak velocity; Wk Weeks
Table 1 summarizes the morphological and echocardiographic characteristics of the study group. Both heart weight/body weight ratios and echocardiographic features suggest that the clip technique creates LVH that subsequently reverses with removal of the clip. While increased heart weights were demonstrated at each time point, regression of this mass was not observed after six weeks of AB. This finding correlates with the increased dimensions and subsequent decrease in fractional shortening identified at six weeks. Whereas three- and four-week banded mice appear to develop concentric LVH, the six-week mice progressed to dilation and reduced function associated with increased pulmonary congestion according to lung weights.
TABLE 1.
Echocardiographic and morphometric parameters
| Parameters | Control | Three weeks AB | Three weeks AB; one week DB | Four weeks AB | Four weeks AB; one week DB | Six weeks AB | Six weeks AB; one week DB | Six weeks AB; two weeks DB |
|---|---|---|---|---|---|---|---|---|
| Morphology | ||||||||
| n | 12 | 11 | 12 | 12 | 13 | 12 | 12 | 10 |
| BW, g | 23.6±0.9 | 23.5±1.7 | 23.3±1.0 | 23.3±1.5 | 23.1±1.1 | 24.0±1.5 | 24.8±1.1 | 24.6±1.3 |
| HW/BW, mg/g | 5.17±0.30 | 7.33±0.77* | 5.75±0.31‡ | 7.42±0.49† | 6.05±0.77§ | 8.64±0.86† | 8.10±1.15† | 8.08±1.02† |
| LW/BW, mg/g | 6.94±0.78 | 8.08±1.24 | 7.51±0.78 | 8.84±1.50 | 8.24±1.38 | 9.50±1.60† | 9.71±1.38† | 9.55±1.85† |
| Echocardiograpy | ||||||||
| n | 6 | 6 | 11 | 6 | 10 | 6 | 6 | 4 |
| Heart rate, beats/min | 505±49 | 490±42 | 511±31 | 517±25 | 529±31 | 504±40 | 511±31 | 512±28 |
| IVSd, mm | 0.76±0.06 | 1.00±0.10† | 0.80±0.06 | 1.09±0.08† | 0.90±0.06 | 0.91±0.10 | 0.97±0.05 | 0.95±0.13 |
| IVSs, mm | 1.06±0.11 | 1.35±0.19† | 1.06±0.02 | 1.42±0.20† | 1.15±0.03 | 1.09±0.11 | 1.25±0.03 | 1.22±0.19 |
| LVIDd, mm | 4.10±0.18 | 4.64±0.33* | 4.33±0.10 | 4.73±0.27* | 4.87±0.16* | 5.05±0.24† | 4.82±0.50* | 4.93±0.19* |
| LVIDs, mm | 3.07±0.34 | 3.30±0.38 | 3.38±0.31 | 3.63±0.35 | 3.83±0.30 | 4.32±0.31* | 4.38±0.07* | 4.05±0.10* |
| LVPWd, mm | 0.65±0.05 | 0.85±0.05* | 0.75±0.06 | 0.96±0.15* | 0.73±0.06 | 0.73±0.09 | 0.75±0.09 | 0.70±0.06 |
| LVPWs, mm | 0.87±0.09 | 1.24±0.10* | 0.93±0.06 | 1.28±0.08* | 0.93±0.09 | 0.88±0.12 | 1.09±0.06 | 0.97±0.07 |
| Ejection fraction, % | 58.0±4.9 | 60.5±6.9 | 59.7±2.5 | 52.9±4.7 | 54.5±2.8 | 42.5±7.8* | 44.7±5.5* | 45.1±2.4* |
| FS, % | 25.2±1.2 | 26.8±4.0 | 25.9±1.5 | 23.4±2.9 | 23.9±3.3 | 15.6±2.1* | 20.9±1.8* | 19.2±1.2* |
Data presented as mean ± SEM unless otherwise indicated.
P<0.05;
P<0.01 compared with control group;
P<0.05 compared with three weeks aortic banding (AB) group;
P<0.05, compared with four weeks AB group. BW Body weight; d Diastolic; DB Debanding; FS Fractional shortening; HW Heart weight; IVS Interventricular septum, LVID Left ventricular internal dimension, LVPW Left ventricular posterior wall, LW Lung weight; s Systolic
Clip removal was significantly associated with regression of hypertrophy after the three- and four-week timepoints (heart weight/body weight ratios from 7.33±0.77 to 5.75±0.31, and 7.42±0.49 to 6.05±0.77, respectively; P<0.05), which was not observed after DB following six weeks of pressure overload. The decompensation of mouse hearts and failure to recover following pressure relief was further observed with direct LV pressure measurements (Table 2). Compared with sham mice, aortic pressure, LV systolic pressure and developed pressure were markedly elevated in banded mice, thus confirming pressure overload and the compensatory functional adaption to increased afterload. After six weeks, LV systolic pressure was reduced whereas the LV end-diastolic pressure was increased, suggesting significant HF. In addition, the LV systolic increasing rate (+dp/dt) and LV diastolic decreasing rate (−dp/dt) were significant reduced in all of the six-week animals. DB at three and four weeks normalized LV pressures, supporting the echocardiographic data, but DB at six weeks left a decompensated heart that was unable to regain LV function.
TABLE 2.
Left ventricular function parameters measured during catheterization
| Parameters | Control | Three weeks AB | Three weeks AB; one week DB | Four weeks AB | Four weeks AB; one week DB | Six weeks AB | Six weeks AB; one week DB | Six weeks AB; two weeks DB |
|---|---|---|---|---|---|---|---|---|
| n | 10 | 10 | 10 | 10 | 9 | 8 | 6 | 6 |
| LVPs, mmHg | 84.2±2.7 | 179.4±5.3* | 115.3±4.9*† | 162.1±5.4* | 114.4±10.0*† | 126.2±7.8* | 93.9±10.5† | 82.2±1.5 |
| LVPdev, mmHg | 82.2±2.8 | 178.3±19.4* | 116.6±4.4*† | 156.2±6.3* | 107.3±9.2*† | 111.4±10.1 | 76.5±7.8 | 76.4±2.8 |
| LVEDP, mmHg | 9.6±1.9 | 8.5±2.0 | 5.2±0.5 | 16.1±2.8* | 10.5±2.2 | 20.8±1.3* | 23.2±3.2* | 19.1±1.8* |
| +dp/dt, +mmHg/s | 3777±201 | 5911±237* | 7452±993*† | 4396±427 | 3397±159 | 3243±240* | 3131±199* | 3332±218 |
| −dp/dt, −mmHg/s | 4389±259 | 8395±277* | 7748±516* | 6071±580 | 4253±246 | 3207±540* | 2874±574* | 3306±279* |
| HR, beats/min | 375±41 | 407±30 | 393±26 | 372±29 | 394±28 | 361±41 | 382±41 | 390±21 |
Data presented as mean ± SEM unless otherwise indicated.
P<0.05 compared with control group;
P<0.05 compared with related aortic banding (AB) group. +dp/dt Rate of pressure rise; −dp/dt Rate of pressure fall; DB Aortic debanding; HR Heart rate; LVEDP Left ventricular end-diastolic pressure; LVPdev Left ventricular developed pressure; LVPs Left ventricular systolic pressure
DISCUSSION
Mechanical constriction of the thoracic and abdominal aorta has been an important experimental technique to create and study pressure overload, LVH and HF. While many groups have used this model to study cardiac remodelling, few have actually removed the source of constriction to focus on mechanisms of regression and reverse remodelling (3,5,9,10). Many investigators use sutures for AB, thereby requiring the aorta to be separated from the surrounding connective tissue circumferentially to place and tie the suture, with variable tension placed during the tying process. Our current technique is substantially faster, less expensive and requires limited dissection (thus making fewer adhesions when returning for DB). Importantly, using a calibrated instrument enabled tight standardization of the intensity of aortic constriction. Finally, the clip dimensions do not change over time, nor does it have the possibility to loosen as a suture may, especially when applied as a slip-knot.
Findings from the present methodological study mirror our previous studies examining pressure overload and subsequent relief (3–5). Although LV function was not significantly reduced between the three- and four-week banded animials, there was a trend toward decreased ejection fraction and slightly increased LV end-diastolic pressures. These observations suggest that the four-week banded animals are moving from a compensated LVH toward a decompensated state. As opposed to the six-week animals, debanding four-week mice enabled regression of LVH. Quite possibly, if we had waited more than one week after debanding the six-week animals, more function may have returned. However, we were striving for a model system that would not take eight to 12 weeks to cycle.
CONCLUSION
While many physical and genetic components can alter the response to pressure overload, it is vital that the technique of generating these physiological conditions is reproducible. This modification involving application and removal of a titanium clip provides a relatively simple and effective method for focused study on both forward and reverse cardiac remodelling.
REFERENCES
- 1.Rockman HA, Ross RS, Harris AN, et al. Segregation of atrial-specific and inducible expression of an atrial natriuretic factor transgene in an in vivo murine model of cardiac hypertrophy. Proc Natl Acad Sci U S A. 1991;88:8277–81. doi: 10.1073/pnas.88.18.8277. [DOI] [PMC free article] [PubMed] [Google Scholar]
- 2.Hu P, Zhang D, Swenson L, Chakrabarti G, Abel ED, Litwin SE. Minimally invasive aortic banding in mice: Effects of altered cardiomyocyte insulin signaling during pressure overload. Am J Physiol Heart Circ Physiol. 2003;285:H1261–9. doi: 10.1152/ajpheart.00108.2003. [DOI] [PubMed] [Google Scholar]
- 3.Stansfield WE, Charles PC, Tang RH, et al. Regression of pressure-induced left ventricular hypertrophy is characterized by a distinct gene expression profile. J Thorac Cardiovasc Surg. 2009;137:232–8. 238e1–8. doi: 10.1016/j.jtcvs.2008.08.019. [DOI] [PMC free article] [PubMed] [Google Scholar]
- 4.Stansfield WE, Rojas M, Corn D, et al. Characterization of a model to independently study regression of ventricular hypertrophy. J Surg Res. 2007;142:387–93. doi: 10.1016/j.jss.2007.01.037. [DOI] [PubMed] [Google Scholar]
- 5.Andersen NM, Stansfield WE, Tang RH, Patterson C, Selzman CH. Recovery from decompensated heart failure is associated with a distinct, phase-dependent gene expression profile. J Surg Res. 2012;178:72–80. doi: 10.1016/j.jss.2011.12.017. [DOI] [PMC free article] [PubMed] [Google Scholar]
- 6.Stansfield WE, Andersen NM, Tang RH, Selzman CH. Periostin is a novel factor in cardiac remodeling after experimental and clinical unloading of the failing heart. Ann Thorac Surg. 2009;88:1916–21. doi: 10.1016/j.athoracsur.2009.07.038. [DOI] [PMC free article] [PubMed] [Google Scholar]
- 7.Stansfield WE, Tang R, Moss NC, et al. Proteasome inhibition promotes regression of left ventricular hypertrophy. Am J Physiol Heart Circ Physiol. 2008;294:H645–50. doi: 10.1152/ajpheart.00196.2007. [DOI] [PubMed] [Google Scholar]
- 8.Moss NC, Stansfield WE, Willis MS, Tang RH, Selzman CH. IKKbeta inhibition attenuates myocardial injury and dysfunction following acute ischemia-reperfusion injury. Am J Physiol Heart Circ Physiol. 2007;293:H2248–53. doi: 10.1152/ajpheart.00776.2007. [DOI] [PubMed] [Google Scholar]
- 9.Gao XM, Kiriazis H, Moore XL, et al. Regression of pressure overload-induced left ventricular hypertrophy in mice. Am J Physiol Heart Circ Physiol. 2005;288:H2702–7. doi: 10.1152/ajpheart.00836.2004. [DOI] [PubMed] [Google Scholar]
- 10.Yang DK, Choi BY, Lee YH, et al. Gene profiling during regression of pressure overload-induced cardiac hypertrophy. Physiol Genomics. 2007;30:1–7. doi: 10.1152/physiolgenomics.00246.2006. [DOI] [PubMed] [Google Scholar]


