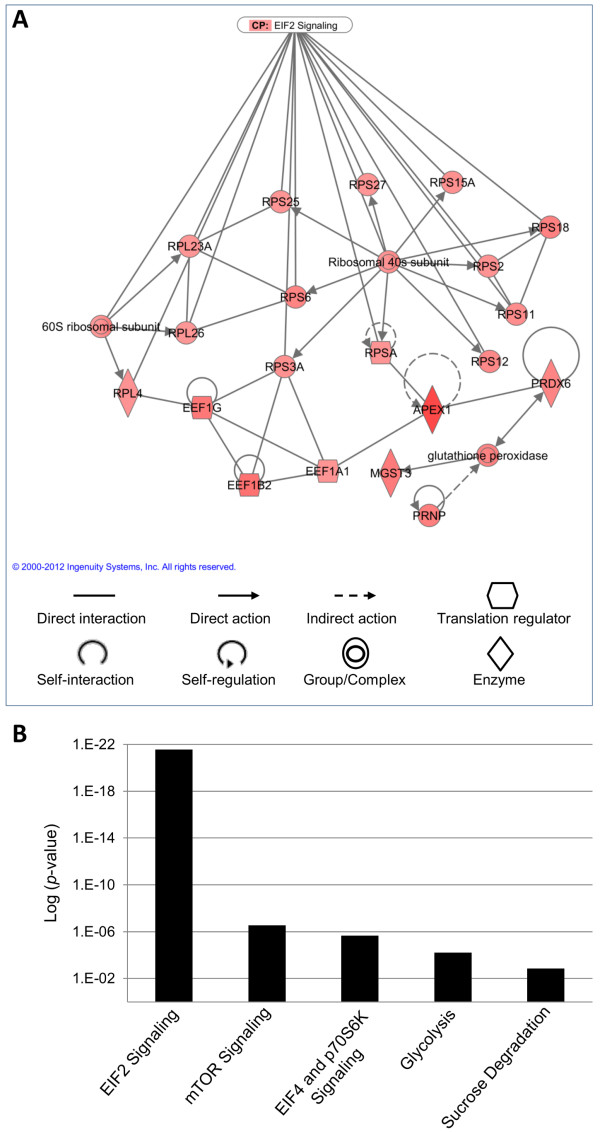
Figure 3.
Cellular network and canonical pathway analysis of genes differentially expressed by enterocytes infected with L. intracellularis. (A) Molecular interaction representing part of the protein biosynthesis network which was most correlated with the set of genes significantly up-regulated in infected cells. Strong interaction between the main canonical pathway (CP: EIF2 signaling) identified in the differentially expressed genes and the protein biosynthesis network. (B) Canonical pathways (x-axis) most associated with genes differentially expressed based on the -log of p-value calculated by Fisher's exact test (y-axis).

