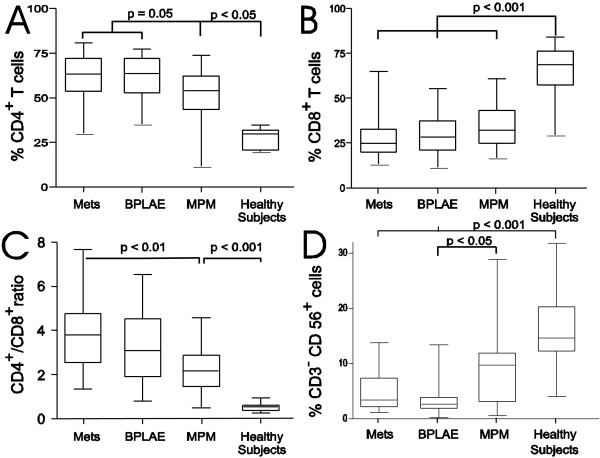
Figure 2.
Distribution of populations in pleural fluid of patients vs. healthy subjects. Distribution of CD4+ (A) or CD8+ (B) T cell subsets, as well as the CD4+/CD8+ T (C) cell ratio and NK cells )D) in the pleural fluid of different groups of patients (pleural metastasis of adenocarcinoma = METS group), patients with benign pleural lesions associated with asbestos exposure = BPLAE group), and patients with malignant pleural mesothelioma = MPM group) vs. healthy subjects. Horizontal line in boxes represent median values, box limits represent 25th (Q1) and 75th (Q3) centiles and whiskers minimal and maximal values.

