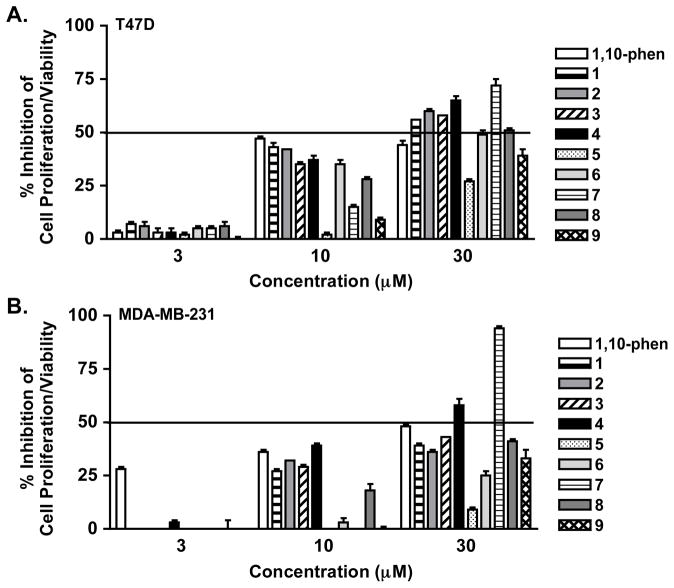
Figure 5.
Effects of 1–9 on cell proliferation/viability. T47D (A) and MDA-MB-231 cells (B) were exposed to 1–9 and 1,10-phenanthroline (1,10-phen) at the specified concentrations for 48 h. Cell viability was determined by the SRB method and presented as “% Inhibition” of the untreated control. Data shown are averages from one representative experiment performed in triplicate and the bars represent standard deviations.

