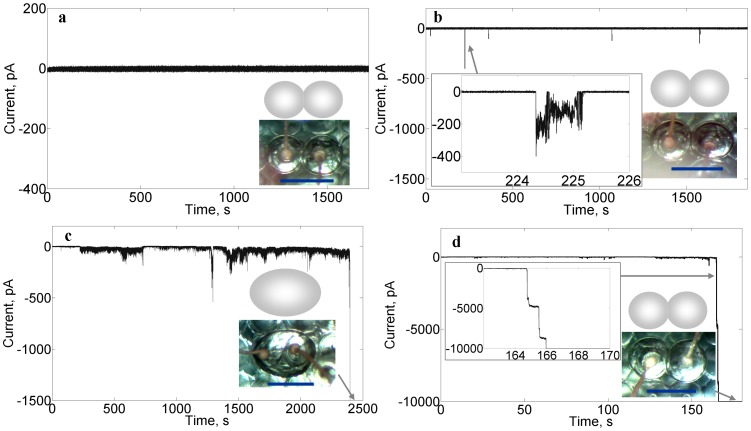
Figure 2. Membrane current responses at various concentrations of cyt c (a, 507 pM; b, 84.7 nM; c, 254 nM; d, 2.54 µM).
Each response is characteristic of a different state of permeabilization: a) impermeable; b) porous, non-lytic; c) porous, lytic; d) highly permeable non-lytic. Inset microscopy images show the state of droplets (unmerged in a,b,d; merged in c); a cartoon image is shown above each microscopy image for further elucidation of the droplet configurations. Inset graphs are detailed images of the current at indicated periods of time. Each droplet contains 200 mM KCl, 10 mM MOPS, pH 7.4 buffer; membrane composition is DPhPC/chol/CL = 55%/25%/20%; and voltage clamp: −50 mV.

