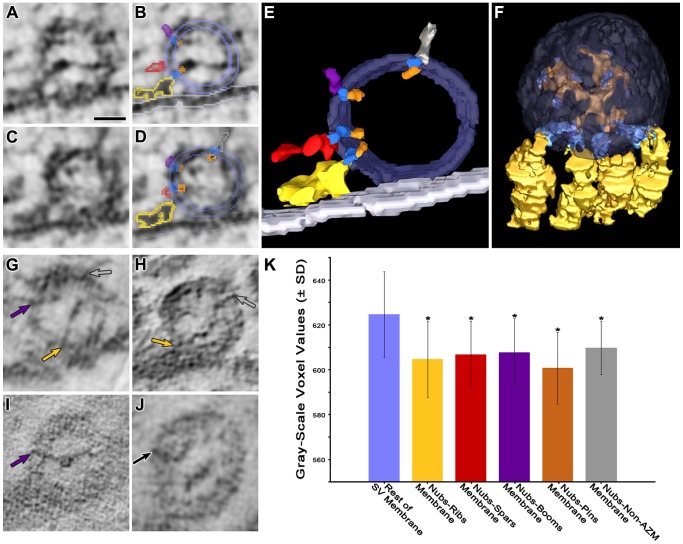
Figure 8. Transmembrane bands of stain linking the connection sites of nubs to AZM and non-AZM macromolecules.
(A) Virtual slice ∼2–3 nm thick through a docked vesicle. (B) Same slice as in (A) with color-coded outlines of portions of nubs (orange), transmembrane bands of stain (darker blue), and portions of a rib (gold), a spar (red), and a boom (purple). The pale blue outlines marking the luminal and outer surfaces of the vesicle membrane are an overlay of this section’s contribution to a 3D surface model of the entire vesicle. The nubs are linked to the rib and boom by the transmembrane bands of stain. The band of stain and nub to which the spar is linked is evident in the next virtual slice, shown in (C). (C) A virtual slice adjacent to the one shown in (A) and (B). (D) Same slice as in (C) with outlines of portions of nubs, transmembrane bands of stain and portions of AZM macromolecules and the surfaces of the vesicle membrane color-coded as in (B). Portion of a non-AZM macromolecule is outlined in pewter. Nubs are connected by the transmembrane bands of stain to the spar, boom and non-AZM macromolecule. (E) Surface model ∼10 nm thick generated from a series of virtual slices showing in 3D the nubs linked by transmembrane bands of stain to the rib, spar, boom and non-AZM macromolecule outlined in (B) and (D). The membrane has been made partially transparent to enable viewing the extent of the transmembrane bands in the z-axis. (F) The membrane of the principal vesicle has been made transparent to reveal the luminal assembly of macromolecules (orange). Four ribs (gold) are connected by transmembrane bands of stain (dark blue) to nubs of the luminal assembly at their sites of connection to the luminal surface of the vesicle membrane. The connection sites of other nubs on the membrane were marked by coloring the portion of the nubs within three voxels of their connection site dark blue. (G–I) Virtual slices from different docked vesicles showing nubs linked to transmembrane bands of stain. In adjacent slices (not shown) the transmembrane bands of stain were linked to an AZM or non-AZM macromolecule as indicated by the colored arrows (ribs, gold; booms, purple; non-AZM macromolecules, pewter). (J) Virtual slice from an undocked vesicle showing a transmembrane band of stain linked to a nub. In the adjacent section, the transmembrane band of stain was linked to a non-AZM macromolecule as indicated by the black arrow. Scale bar (A–D,G–J) = 25 nm. (K) For a single vesicle, the frequency distribution of the voxel gray-scale values (ranging from 0, black, to 1000, white) of the narrow region of the vesicle membrane between nub connection sites and the connection sites of opposed AZM and non-AZM macromolecules, i.e. the region containing the transmembrane band of stain, was compared with the voxel gray-scale values for the rest of the synaptic vesicle (SV) membrane. The voxel gray-scale values in the regions between 24 nubs and their opposed ribs (4), spars (2), booms (6), pins (4) and non-AZM macromolecules (8) were on average significantly darker than the rest of the vesicle membrane (asterisks) as determined by ANOVA with a Tukey Post Hoc Test (p<0.05). An additional 7 vesicles were similarly tested and the results are displayed in Table 1 (details of results from this vesicle are shown at #8 in Table 1). Altogether, the findings indicate that, on average, the transmembrane regions linking nubs to AZM and non-AZM macromolecules have a greater density of stained material than the remainder of the vesicle membrane.

