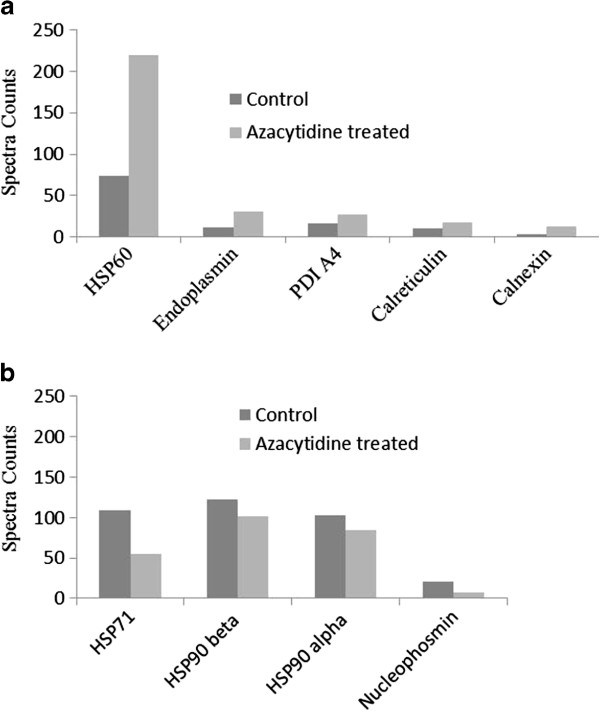
Figure 5.

Azacytidine induced changes in chaperones. (a) The fold of changes of ER- and mitochondrial chaperones from the untreated and 100 μM azacytidine-treated U266 cells for 24 h; (b) The fold of changes of cytosolic and nuclear chaperones from untreated and 100 μM azacytidine-treated U266 cells for 24 h. The number on the y axis represents spectra counts for each identified protein.
