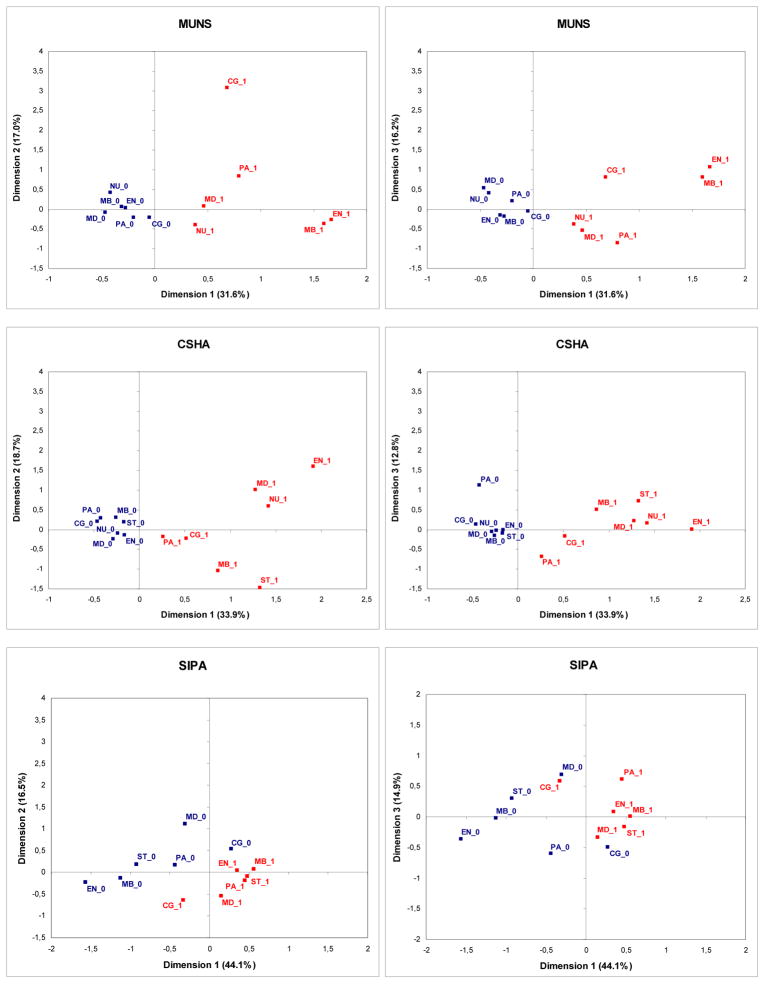
Figure 1. Relationship among the frailty domain variables across the three studies -Results of the multiple correspondence analysis.
MUNS: Montreal Unmet Needs Study; CSHA: Canadian Study of Health and Aging; SIPA: Integrated Services for Older Persons; NU: Nutrition, PA: Physical Activity, MB: Mobility, ST: Strength, EN: Energy, CG: Cognition, MD: Mood; Suffix 1 = presence of deficit; Suffix 0 = absence of deficit; Percentages for each axis correspond to proportion of explained inertia in each dimension.

