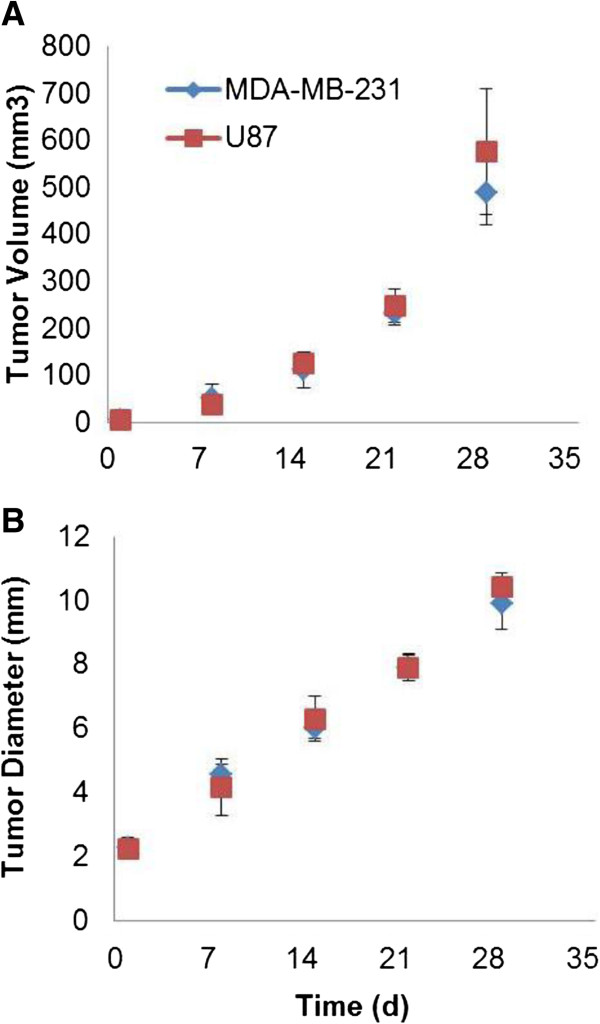
Figure 2.

Tumor volume measurements and calculated diameter throughout the experiment. The (A) tumor volume measurements and (B) calculated diameter are for MDA-MB-231 and U87 mice. Day 1 is the date when the first PET scan was performed. Error bars represent 1 SD.
