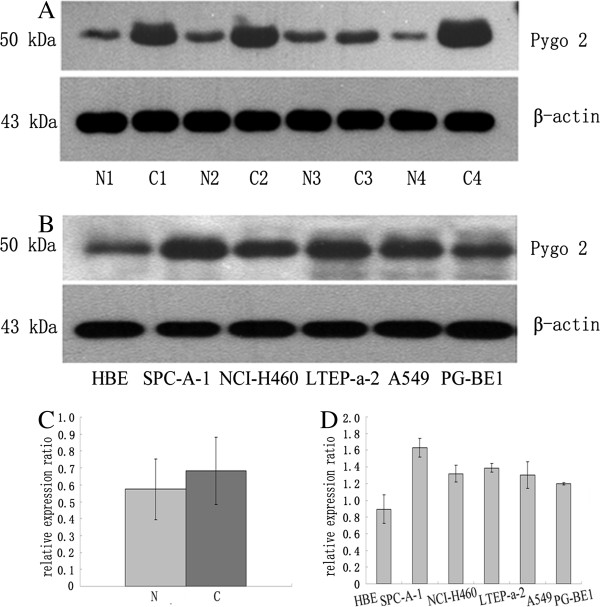
Figure 3.
Pygo2 is overexpressed in lung cancer tissues. (A) Pygo2 (50 kDa band) had increased signal intensity in lung cancer samples (C1–C4) compared with the matched normal lung tissues (N1–N4). (B) Increased Pygo2 expression was detected in different lung cancer cells compared to the immortalized bronchial epithelial cell line, HBE. Positions of the molecular weight markers are indicated. Pygo2 protein levels were normalized to β-actin. Statistical analysis showed increased Pygo2 expression in lung cancer tissues (C; P = 0.007) and cell lines (D; SPC-A-1, P = 0.038; NCI-H460, P = 0.022, LTEP-a-2, P =0.042, A549, P = 0.047, BE1, P = 0.034) compared to matched normal lung tissues.

