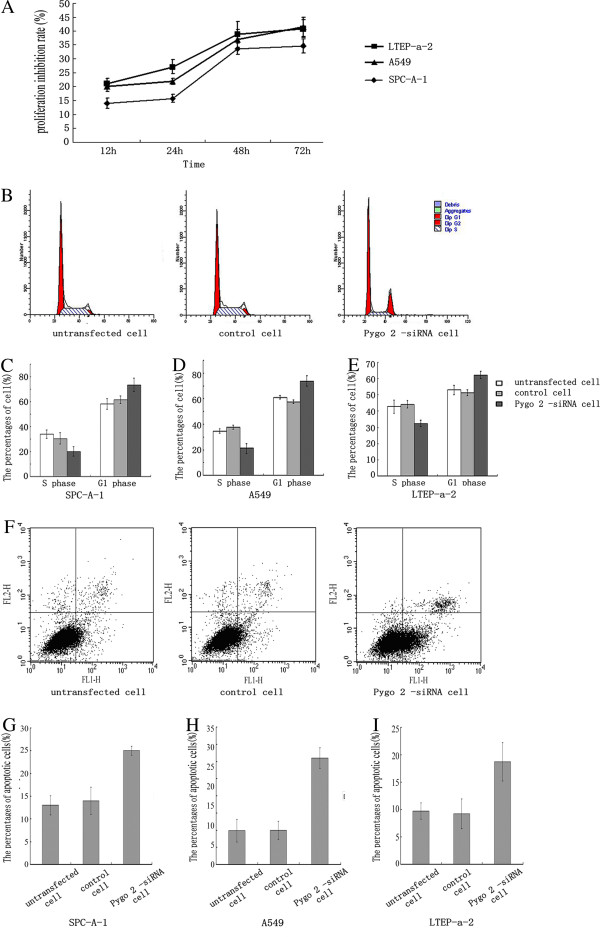
Figure 5.
Pygo2 knockdown inhibits lung cancer cell growth. (A) MTT assays showing that decreased Pygo2 expression inhibited the proliferation of SPC-A-1, A549 and LTEP-a-2 cells. This trend was especially pronounced after 48 h. The y-axis shows the proliferation inhibition rate (%) and the x-axis indicates time after transfection. (B) Representative flow cytometry results for SPC-A-1 cell cycle. Treatment with Pygo2 siRNA lead to a significant increase in the proportion of G-phase cells and a significant reduction in S-phase cells, compared with untransfected and control cells. (C-E) Statistical analysis of the flow cytometry data for SPC-A-1, A549 and LTEP-a-2 cell cycles, respectively. (F-I) Apoptotic cell death was determined by flow-cytometric analysis with Annexin V and PI staining. The percentage of apoptosis, including early and late stage of apoptotic cell death in each group, is shown. (F) Representative results for SPC-A-1 cells showed that knockdown of Pygo2 led to an increase of apoptotic cells compared with untransfected or control cells. (G-I) Statistical analysis of the flow cytometry data for apoptosis in SPC-A-1, A549 and LTEP-a-2 cell, respectively.

