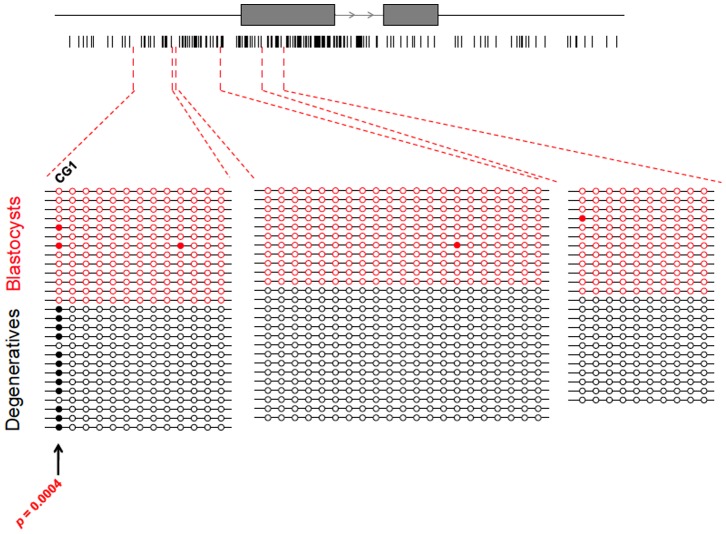
Figure 3. DNA methylation of PHLDA2 in IVF embryos.
Exons of PHLDA2 are indicated by grey boxes and the direction of transcription is indicated by arrowheads. Vertical bars below the gene model represent CpG sites near and within PHLDA2. The CpG island overlapping with PHLDA2 is shown as an open rectangular box. For methylation analysis, each line connecting circles represents a single clone. Filled circles indicate methylated CpGs while open circles represent unmethylated CpGs. Clones derived from blastocysts and degenerate embryos are shown in red and black respectively. CpG sites tested for differential methylation are marked by arrows. Significant differential methylation of CpG sites are indicated by p values.

