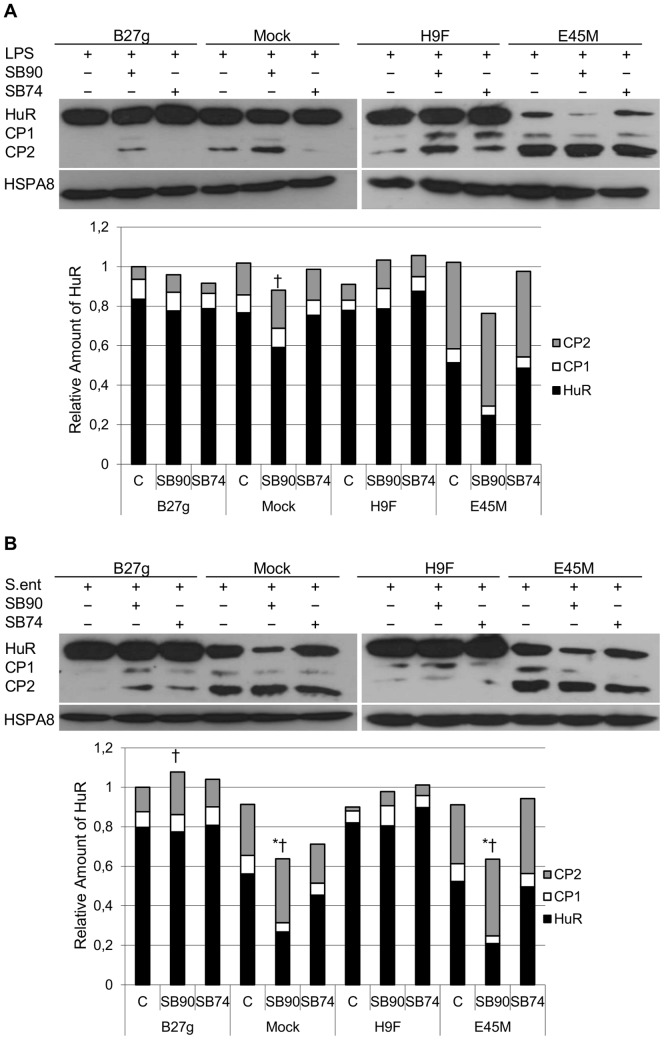
Figure 3. p38 inhibition effects on HuR expression and regulation in U937 monocytic cells.
Full length HuR (36 kDa) and HuR cleavage products (CP1; 24 kDa and CP2; 8 kDa) in LPS-stimulated (A) and Salmonella enteritidis-infected (B) p38 inhibitor- or negative control for p38 inhibition-treated U937 Mock, B27g, H9F and E45M cells at 5 h time point (SB90; p38 inhibitor SB202190 and SB74; control for p38 inhibition SB202474) Expression of HuR was determined by SDS-PAGE and Western blotting. HSPA8 was used as a loading control. Results from densitometric analysis of five independent experiments are shown in diagram. See Materials and Methods for details. * = P-value ≤0.06 for HuR and † = P-value ≤0.06 for CP2 versus untreated sample at the respective cell line.

