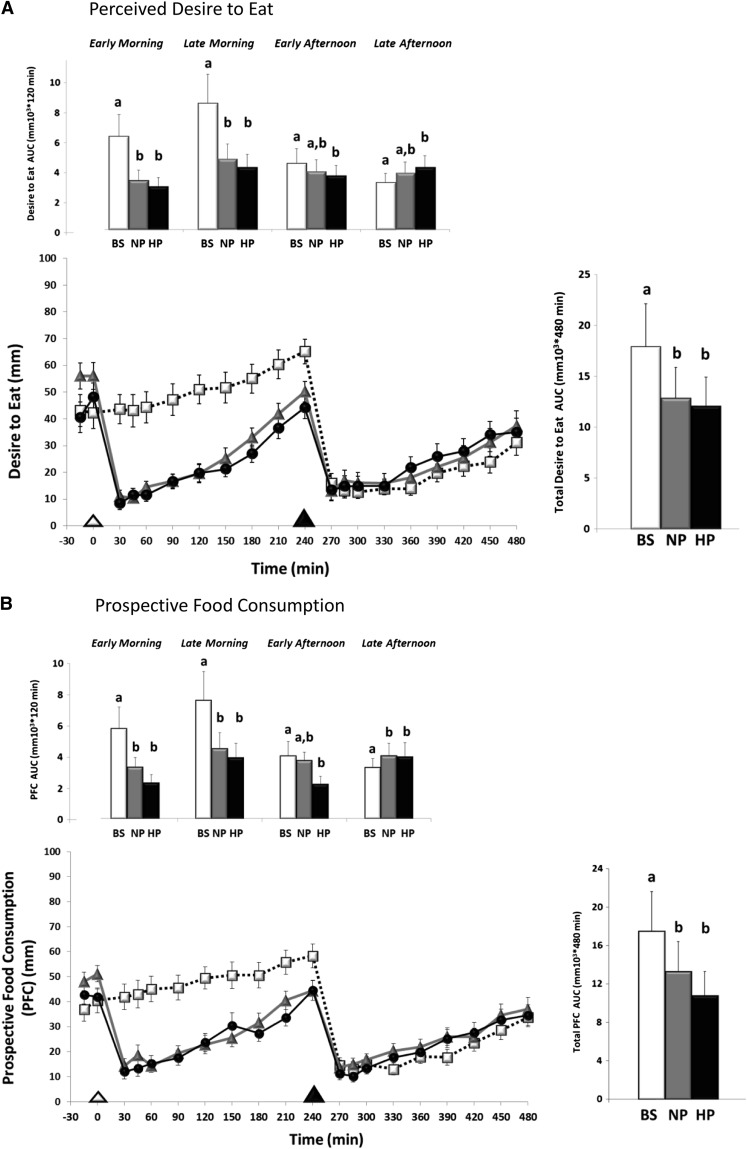
FIGURE 3.
Desire to eat (A) and preoccupation with thoughts of food (B) throughout the testing days in 20 adolescent girls. The line graph displays the time course of change throughout the 10-h days in the BS (□), NP (△ ), and HP (•) patterns; the bar graphs depict total and specific time segment AUCs across the day. Post hoc pairwise comparison analyses were performed when main effects and interactions were detected. Different lowercase letters denote significance between testing days (P < 0.05). The △ on the x-axis denotes the breakfast meal; the ▴ on the x-axis denotes the lunch meal. BS, breakfast skipping; HP, high protein; NP, normal protein; PFC, prospective food consumption.

