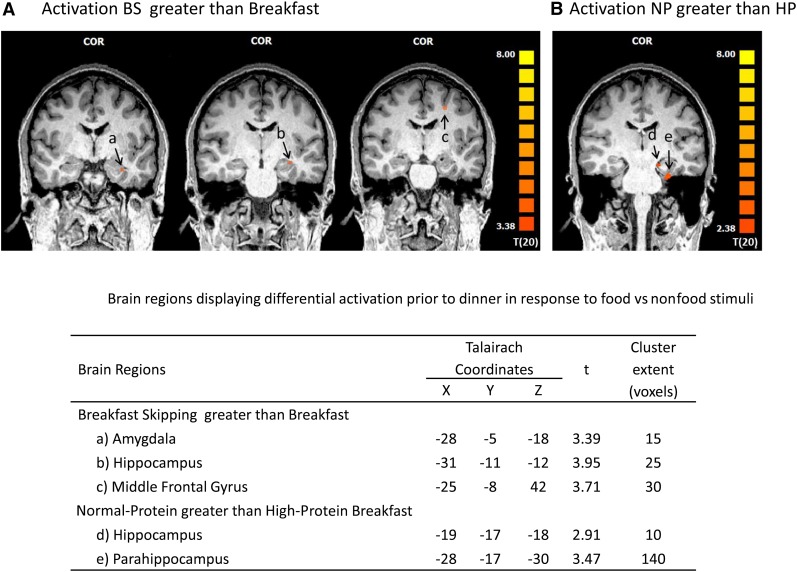
FIGURE 5.
(A, B) Brain activation contrast maps before dinner after the BS, NP, and HP testing days in 20 adolescent girls; all contrasts represent food greater than nonfood (animal) fMRI scans. Repeated-measures ANOVA examining the main effect of treatment with post hoc pairwise comparison analyses were performed when a main effect was detected. P < 0.01 represented significance. BS, breakfast skipping; COR, coronal view; HP, high protein; NP, normal protein.

