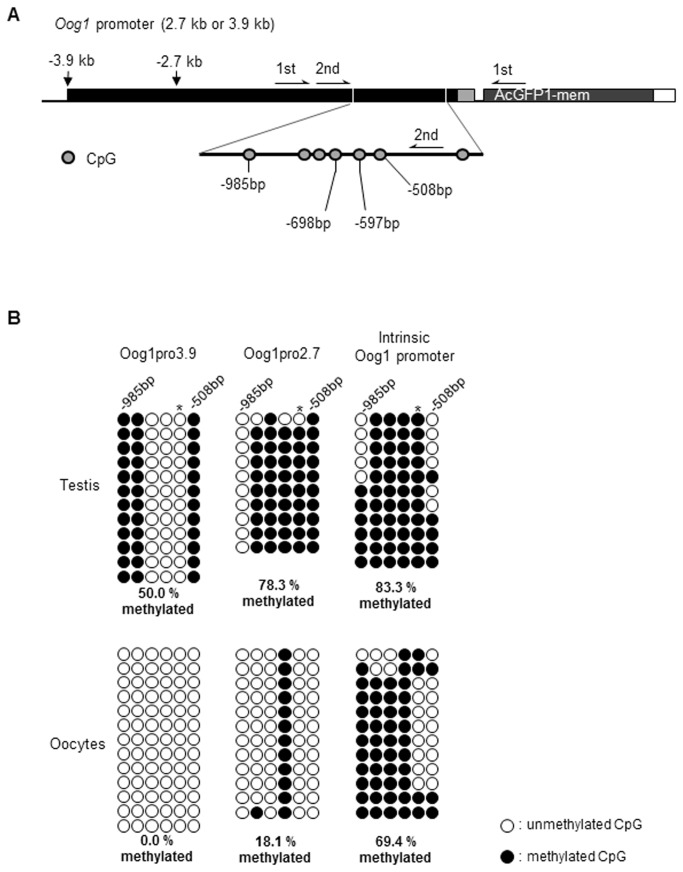
Figure 6. Bisulfite-sequencing analysis of the methylation status of the Oog1 promoters.
A. Location of CpGs and amplification primers on the Oog1 promoter. The conserved 2.7 kb promoter region was analyzed with a program to predict DNA methylation (methylator, http://bio.dfci.harvard.edu/Methylator/index.html) and the indicated region (-508 bp to -985 bp) was selected for analysis of methylation status. Primers specifically recognizing the transgene were used for amplification of bisulfite-converted genomes (see materials and methods). B. DNA methylation status of individual CpGs is shown. Open circles indicate unmethylated, and filled circles indicate methylated CpG dinucleotides. Total methylation ratios were indicated under the diagrams. Asterisks indicate a significant difference in methylation status of individual CpGs between GFP expressed and non-expressed cells/tissues (p<0.05, Fisher’s exact test).

