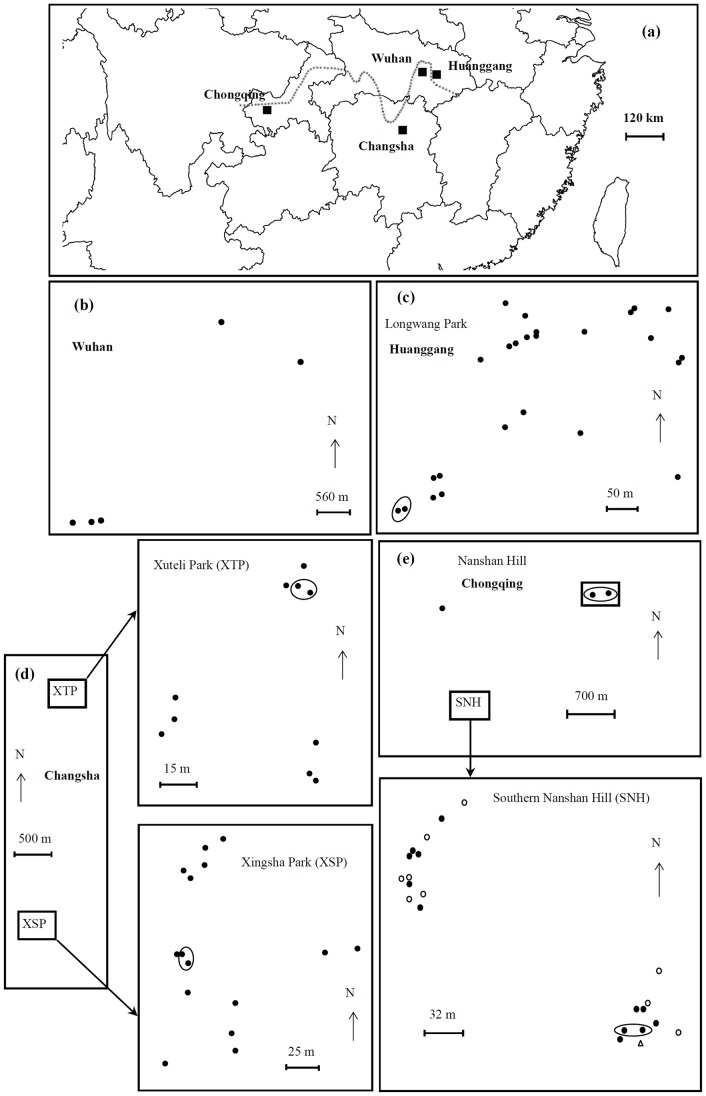
Figure 1. Map of the sample locations for the studies of population structure and reproductive mode.
(a) Overview over the locations of the cities in China where samples were obtained from (Huanggang, Changsha and Chongqing and Wuhan). (b) Sample sites of entire nests including neotenics from Wuhan City, Hubei Province. (c) Sample sites of workers from Longwang Park,Huanggang City, Hubei Province. (d) Sample sites of workers from Xuteli Park and Xingsha Park, Changsha City, Hunan Province. (e) Sample sites of workers from Nanshan Hill, Nanan District, Chongqing City. The dotted line represents the Yangtze River. Genetic analyses revealed two subpopulations in Chongqing city (filled circle subpopulation 1; open circle subpopulation 2; Open triangle representing one colony that could not be assigned to either subpopulation of Chongqing. The loops represent samples assigned to the same colony.

