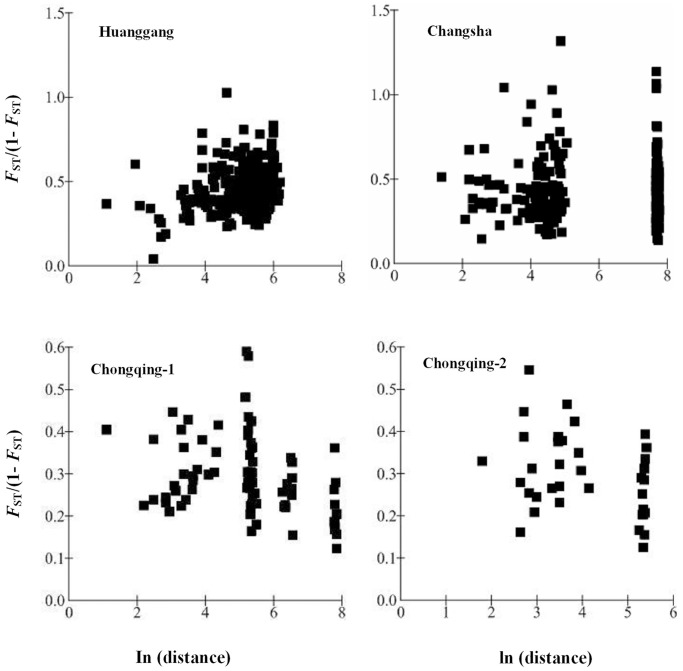
Figure 3. Isolation by distance analysis for the colonies within each population.
The correlation coefficient was significant for the relationship for Huanggang population (r = 0.2245, P = 0.0014, Mantel test). The correlation coefficients were not significant for either of the relationships (r = 0.0130, −0.3284 and −0.3426, P = 0.4462, 0.9654 and 0.9015, Mantel test, for Changsha, Chongqing-1 and Chongqing-2 population, respectively).

