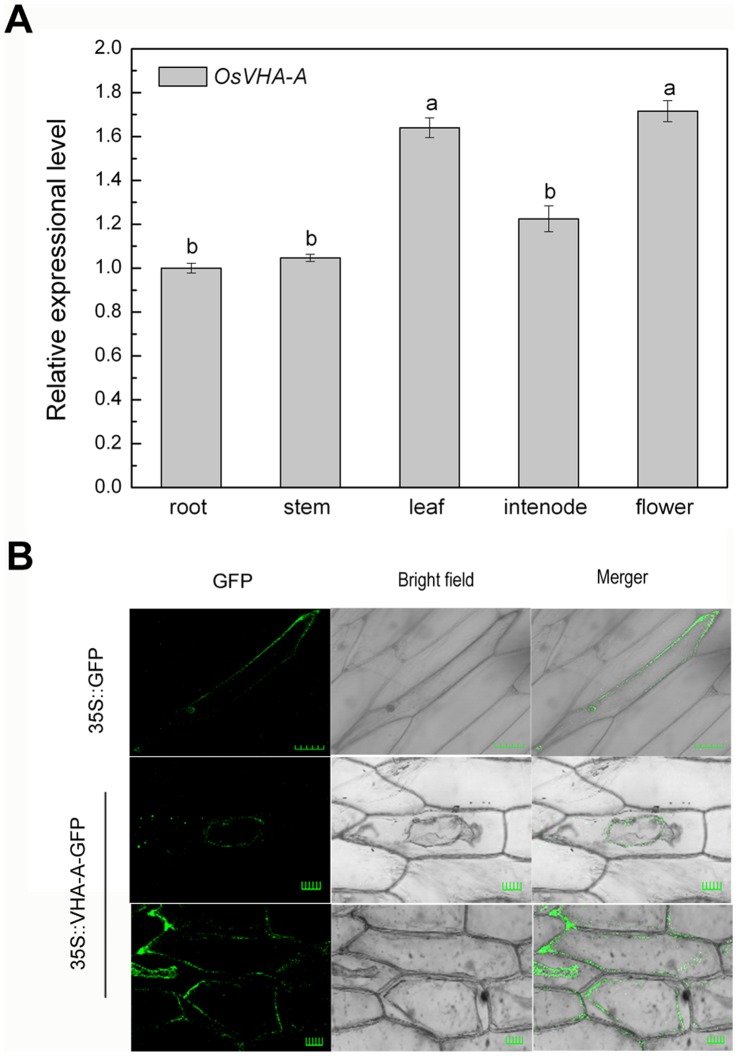
Figure 1. Expression pattern of OsVHA - A in various tissues and subcellular location of OsVHA-A.
(A) Expression levels of OsVHA-A revealed by real-time quantitative RT-PCR in root, stem, leaf, internode, and flower in rice cv. Nipponbare. Actin was amplified as internal control. Different letters indicate statistically significant differences among each tissue (Duncan’s multiple range test, P<0.05). (B) Subcellular localization of OsVHA-A-GFP fusion protein in onion epidermal cells with the control of GFP. Transient expression was performed by using Agrobacterium tumefaciens (strain EHA105)-mediated infiltration. Scale bars = 50 µm.

