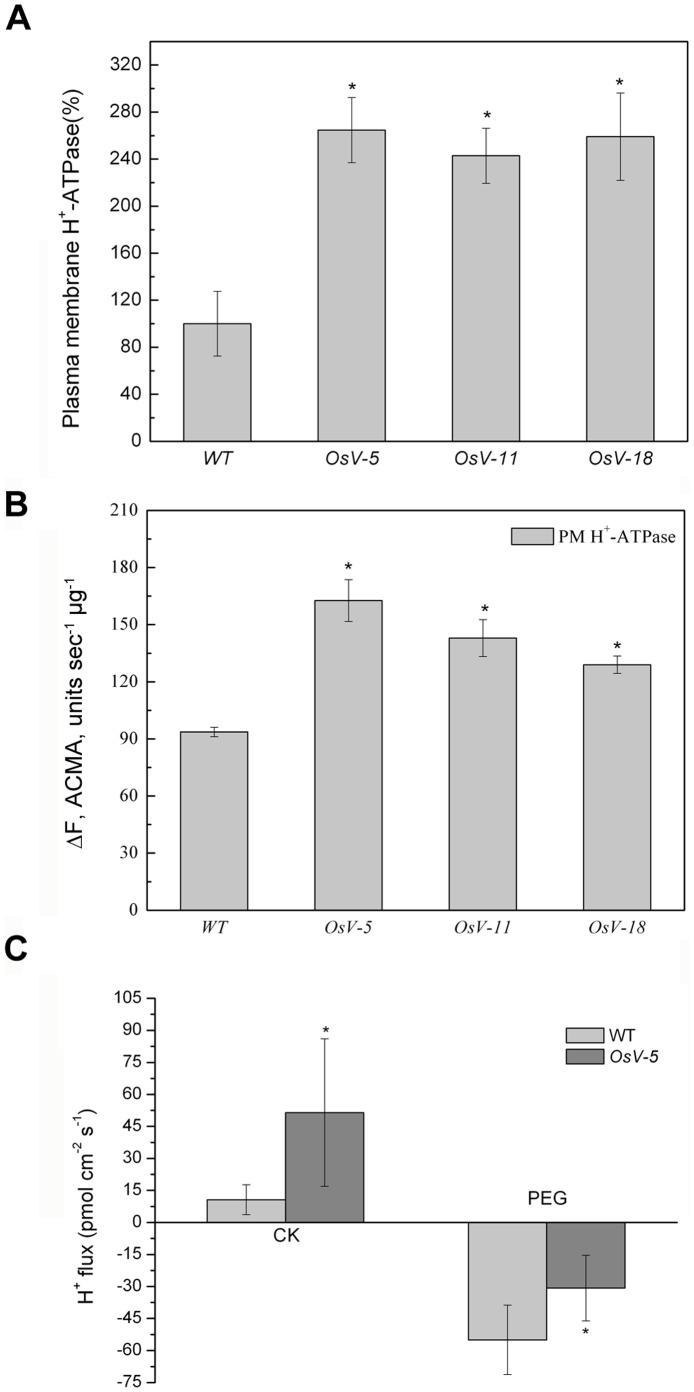
Figure 5. The H+ efflux in OsVHA - A-RNAi lines.
(A) Plasma membrane H+-ATPase activity was determined in wild type (WT) and three OsVHA-A RNA interference lines (OsV-5, OsV-11, and OsV-18). (B) Plasma membrane H+-ATPase proton-pumping measured by the quenching of ACMA fluorescence. Ten micrograms of tonoplast vesicles were applied to detect fluorescence density. (C) The H+ fluxes determined by micro-test system in wild type and transgenic line (OsV-5) under normal (CK) and 20% PEG6000 treatment (PEG). The positive values mean ion effluxes, whereas negative values show ion influx. Values are means ± SE (n = 6). Asterisks (*) indicate significant differences from WT at P<0.05.

