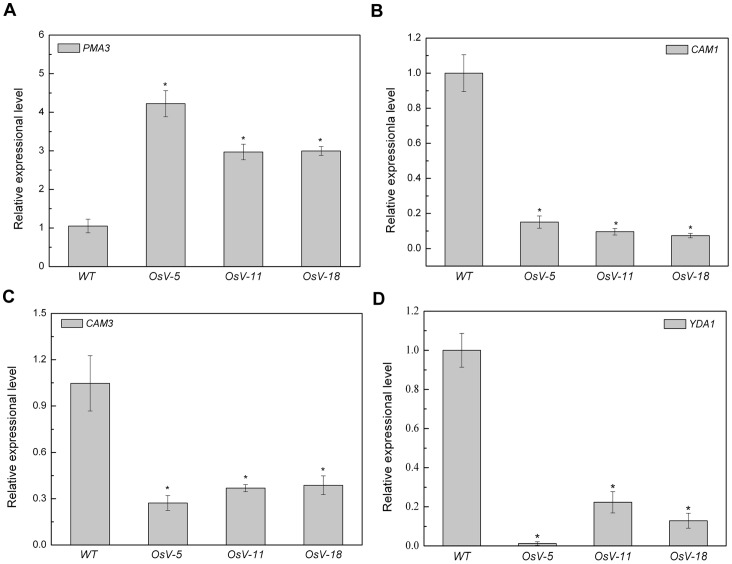
Figure 10. Alteration of gene expression resulting from downregulation of OsVHA - A.
Real-time quantitative RT-PCR analysis of mRNA levels of PMA3 (A), CAM1 (B), CAM3 (C), YDA1 (D) in wild-type (WT) and three independent Os-VHA-A deficient lines (OsV-5, OsV-11, and OsV-18). Asterisks (*) indicate significant differences from WT at P<0.05.

