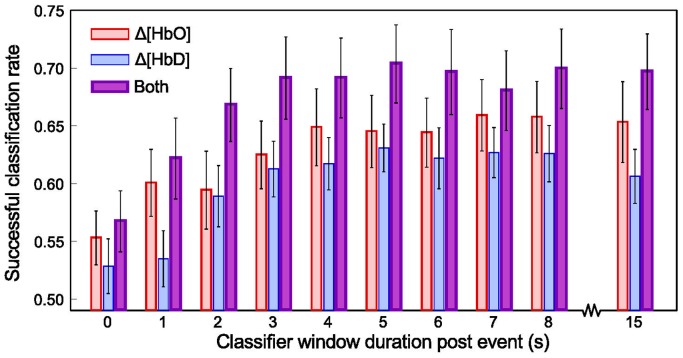
Figure 7. Classifier performace for different data windows and types.
Mean±SEM classifier success rate (equal to the mean of the diagonal elements in the confusion matrices) across 20 experiments inluding both color conditions (n = 776 rewards; n = 683 penalties) for varying sizes of peri-event window, when using different components of the NIRS hemodynamic signal. All windows began at cue onset. Thus, the 0 window duration post event corresponds to the use of 8 seconds of data between cue onset and the outcome event. All other windows include post-outcome data.

