
Figure 8. Performance of the QSARSA learner when faced with noisy reward signals.
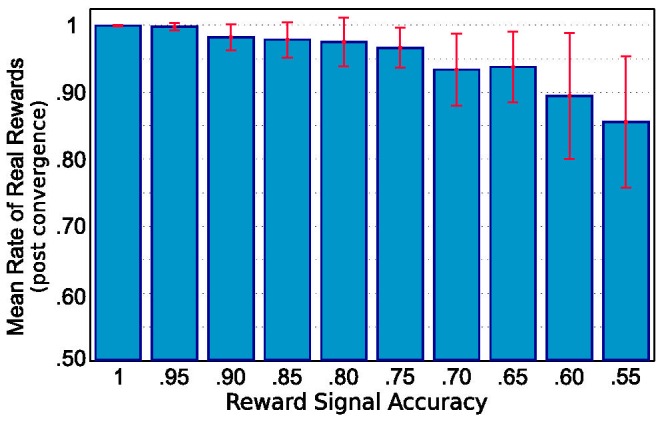
Each bar represents the results for a set of trials with feedback accuracy to the agent as indicated along the horizontal axis. Bar heights represent mean fractions of true reward outcomes (i.e. trial successes) out of 20,000 trials after convergence. Error bars are standard deviations. With increasing reward signal accuracies, the rates of reward improve and the inter-trial variance decreases.