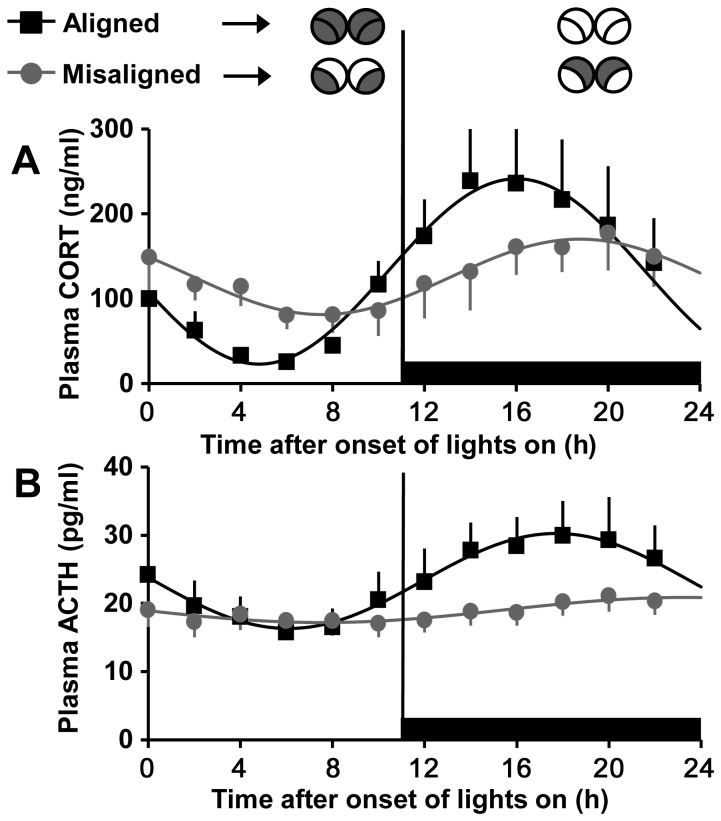
Figure 3. Plasma corticosterone and ACTH rhythms are disrupted in Sham-operated forced desynchronized rats.
Plasma corticosterone (A) and ACTH (B) in Sham treated rats on aligned (black) and misaligned (grey) days. Black horizontal bars denote times when lights are off. Illustrations (top) show predicted Per1 expression patterns, as in Figure 2. Data are means ± SEM and fitted with a sine wave function (see materials and methods). n= 6 rats/group.

