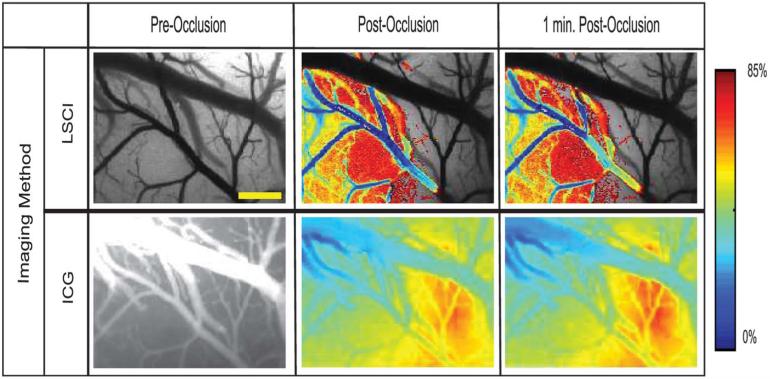
FIGURE 4.
Images collected from animal 1 by the use of both imaging techniques at multiple time points before and after vessel occlusion that have been overlaid with a color map of changes in correlation time (relative blood flow) and ICG intensity with respect to the baseline image where blue indicates a decrease in overall intensity (red indicates increase). Images have been thresholded to show any areas with a flow decrease of 15% or more (85% of baseline). Scale bar = 0.5 mm. LSCI, laser speckle contrast imaging; ICG, indocyanine green.

