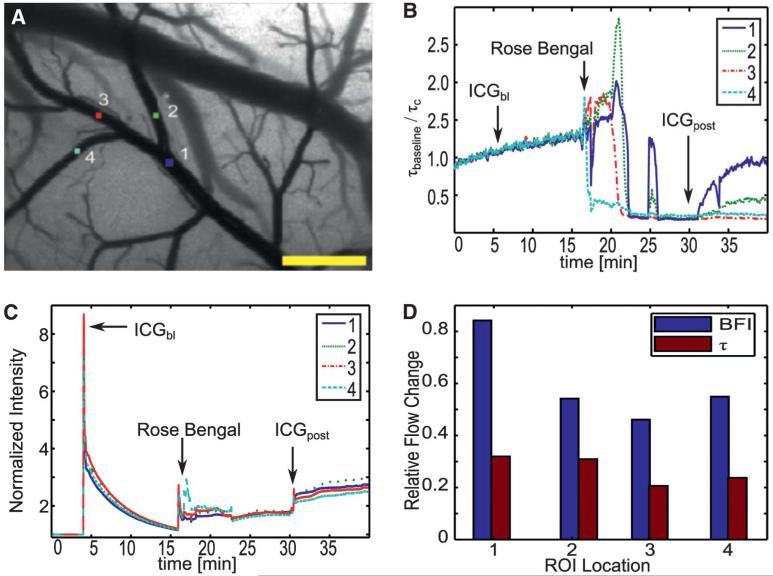
FIGURE 5.
Measured temporal changes for animal 1 in 4 various regions of interest (ROIs) (A), shown as relative blood flow change for LSCI (B) and relative intensity changes for ICG images (C, D). Scale bar = 0.5 mm. LSCI, laser speckle contrast imaging; ICG, indocyanine green; BFI, blood flow index.

