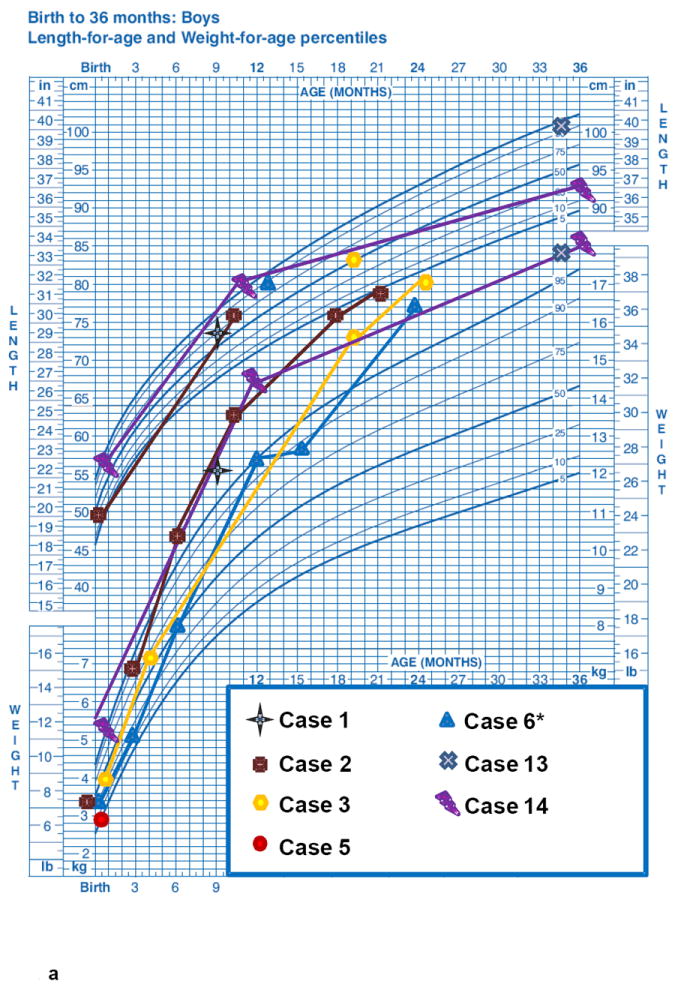
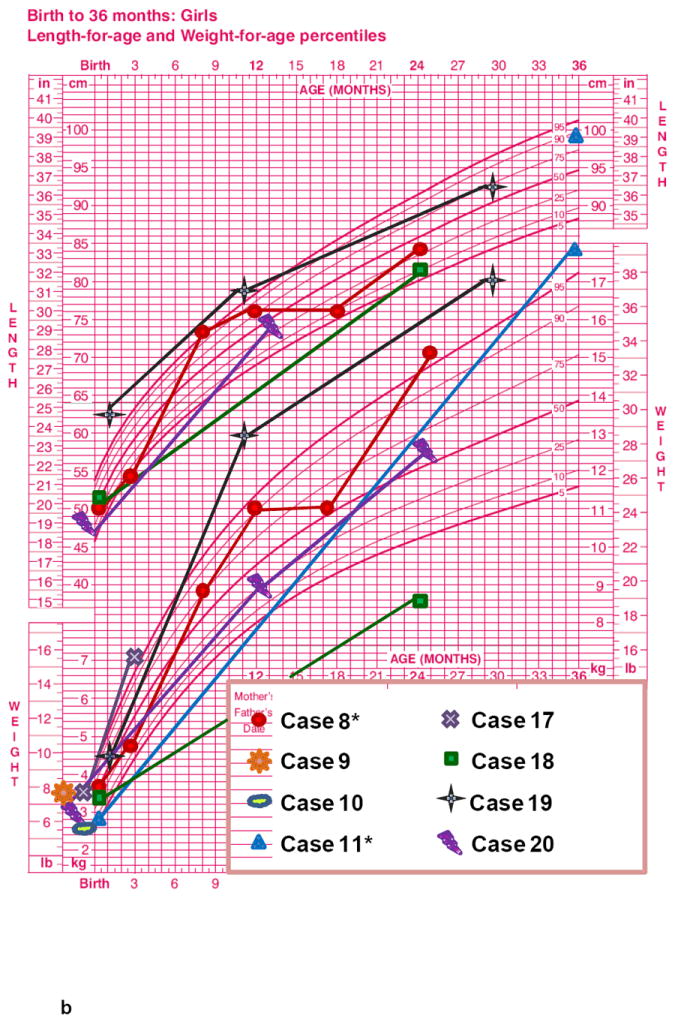
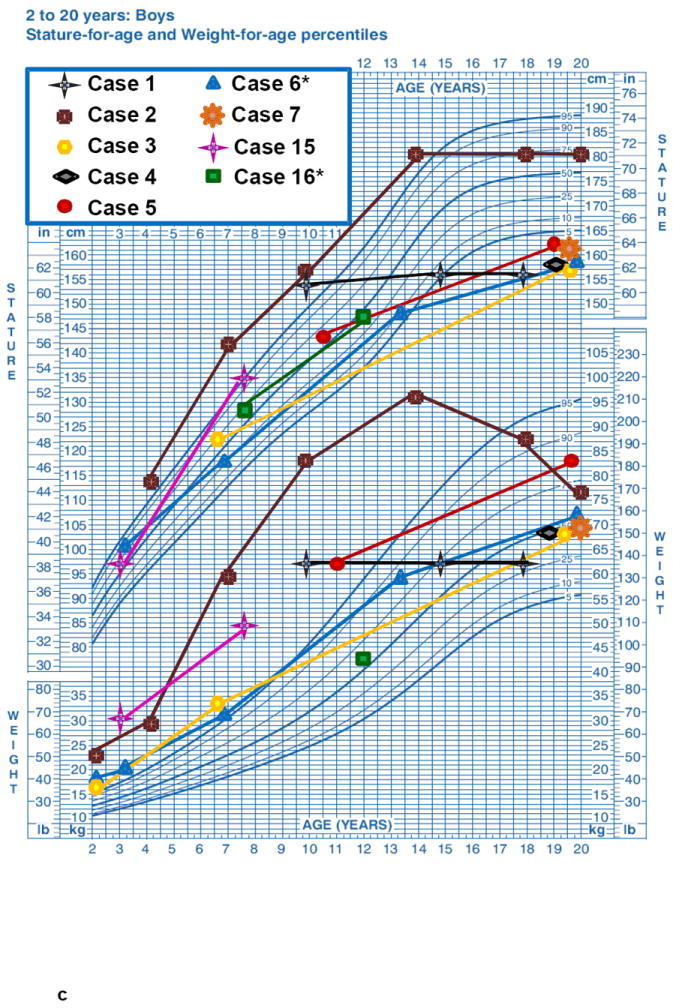
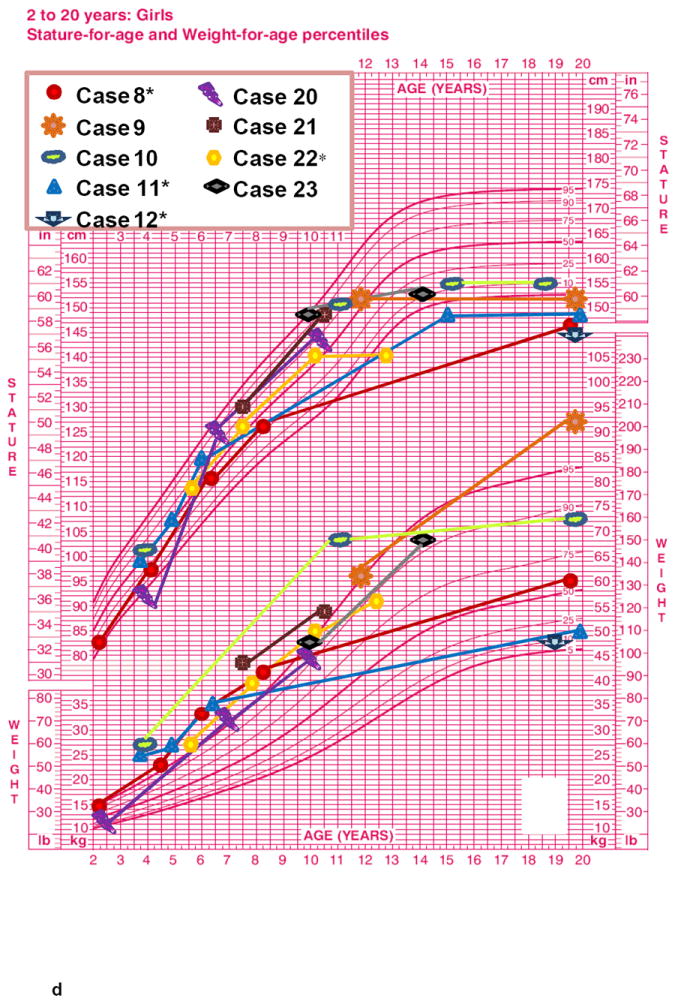
Figure 1. Growth curves of ALMS patients (longitudinal).


Height-age and weight-age curves were constructed utilizing the charts developed by the National Center for Health Statistics in collaboration with the National Center for Chronic Disease Prevention and Health Promotion, for boys (blue) and girls (pink), in the period from birth to 36 months (a - b) and from 2 to 20 years (c - d). Each patient is represented by a specific symbol as designated in the legend. * = patients with biochemical growth hormone deficiency when tested with GHRH+Arginine.
