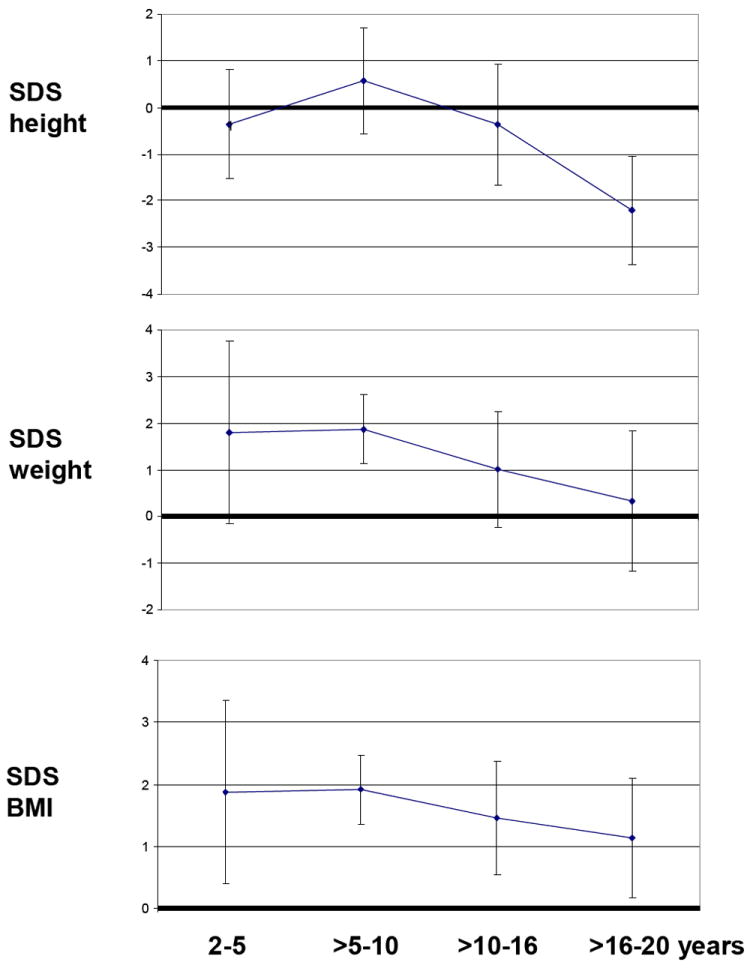
Figure 2. SDS height, weight and BMI of ALMS patients (cross-sectional).

Graphic representation of SDS (Standard Deviation Score) height, weight and body mass index of ALMS patients across the different age groups. Results are expressed as mean values ± SD.
