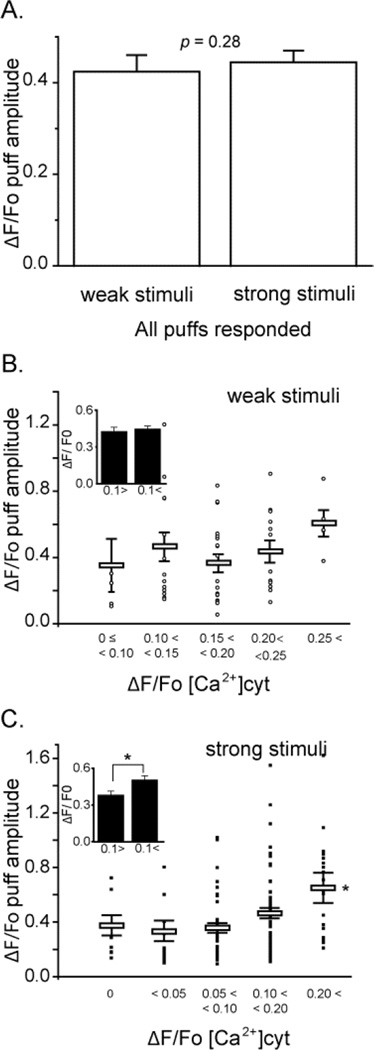
FIGURE 4. The amplitude of InsP3-evoked puffs is only weakly dependent on the basal cytosolic [Ca2+].
(A) Mean puff amplitudes evoked by weak photorelease of InsP3 (ΔF/Fo = 0.42 ± 0.04, n = 56) and strong photorelease (ΔF/Fo = 0.44 ± 0.23, n = 146. p > 0.05), after pooling data across all basal cytosolic [Ca2+] levels. (B) Main panel shows a scatter plot of amplitudes (ΔF/F0) of puffs evoked by weak photorelease of InsP3 as a function of increase in basal fluorescence during Ca2+ influx. Open circles mark data from individual puffs and bars show mean ± SEM. (C) Corresponding measurements of puff amplitudes following strong photorelease of InsP3. Inset graphs in (B) and (C) represent mean values of puff amplitudes evoked, respectively, by weak and strong photolysis flashes grouped for cytosolic [Ca2+] elevations < 0.1 and > 0.1 ΔF/Fo.

