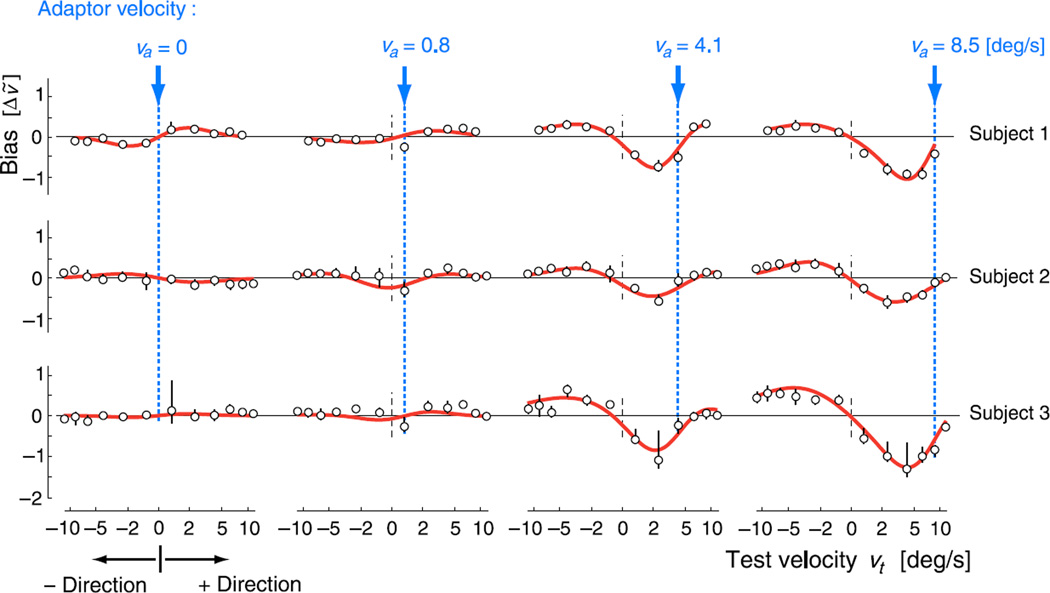
Figure 3.
Perceptual estimation bias due to adaptation. Each row shows the perceptual biases of one subject, for each of four adaptation conditions, with adaptor velocities indicated by arrows and dashed vertical lines. Hollow points represent measured shifts in the point of subjective equality with respect to the control condition. Error bars represent the 5–95% quantiles of extracted biases, based on 1000 bootstrap samples of the data. Red bold lines indicate the bias of the two-mechanism model, fitted separately for each subject, using a total of 9 free parameters (see also Figure 4). Both axes represent nonlinearly transformed velocities (see Methods section), with horizontal and vertical distances scaled identically. Note that bias is a signed velocity difference; thus positive bias for negative test velocities indicates reduced perceived speed, while positive bias for positive test velocities indicates increased perceived speed. All subjects show similar behavior, with adaptation affecting subsequent perception over the whole range of test velocities, including test stimuli moving in the opposite direction.

