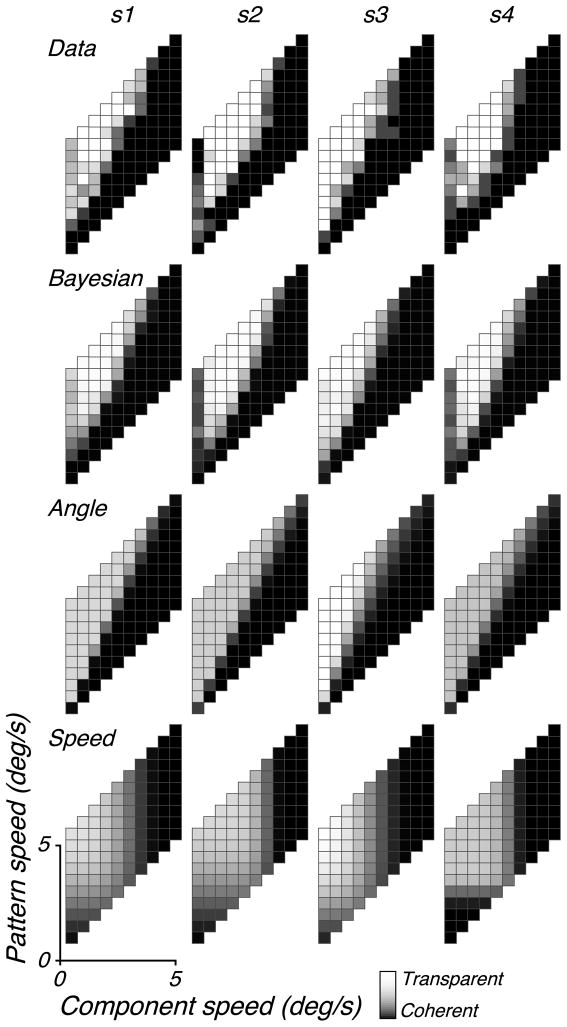
Figure 5.
Perceptual data for four subjects, together with simulated percepts of three models that were fit to the data. In all plots, the intensity of each square indicates the probability that the associated plaid stimulus is perceived as transparent (see Figure 4).

