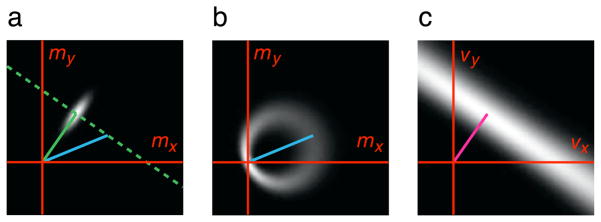
Figure B1.

Derivation of the likelihood function. (a) Gaussian probability distribution of normal velocity measurements (gray-scale), p(m⃑|θ, v⃑), for a grating with normal velocity specified by the green vector, but moving at physical velocity specified by the blue vector. The constraint line (dashed green) of all translational velocities consistent with the normal velocity of that grating is also shown. (b) The distribution of normal velocity measurements (grayscale), p(m⃑|v⃑), for an arbitrary spatial pattern moving with the specified physical velocity (blue vector). This is computed by integrating over all directions, θ, as in Equation B3. (c) The likelihood, a function of v⃑, obtained by evaluating p(m⃑|v⃑) for a particular normal velocity measurement m⃑ (magenta vector) drawn from the distribution in (a).
