
Fig. 1.
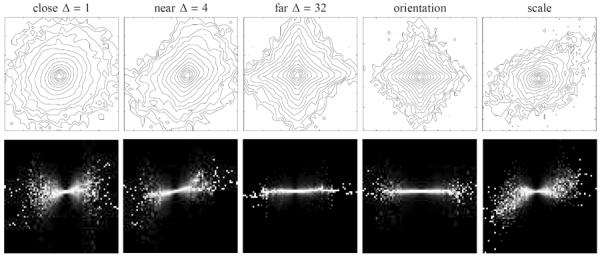
Histograms of pairs of subband coefficients of four photographic images, decomposed using a Steerable Pyramid decomposition [29]. Top: Contour plots of joint histograms, drawn at equal intervals of log probability. Bottom: Conditional histograms, computed by independently normalizing each column of the joint histogram. Image intensities are proportional to probability, except that each column of pixels is independently rescaled so that the largest probability value is white.