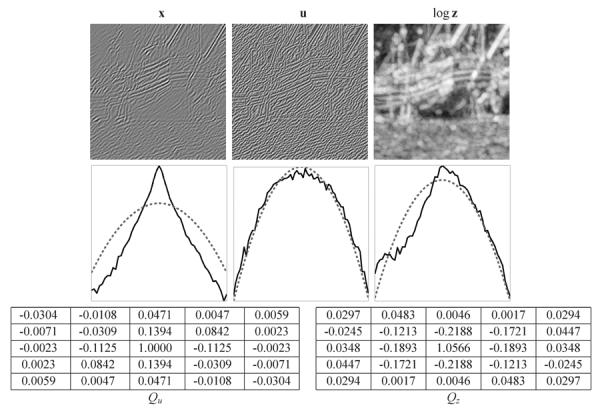
Fig. 2.

Top: Decomposition of a subband from image “boat” (left) into a hGMRF u (middle) and the corresponding multiplier field log z (right). Each image is rescaled individually to fill the full range of grayscale intensities. Middle: log marginal histograms of x, the estimated u and the estimated log z. Dotted lines correspond to Gaussian density of the same mean and variance. Bottom: 5 × 5 central non-zero regions for the hGMRF generating kernels of the estimated u and log z fields.
