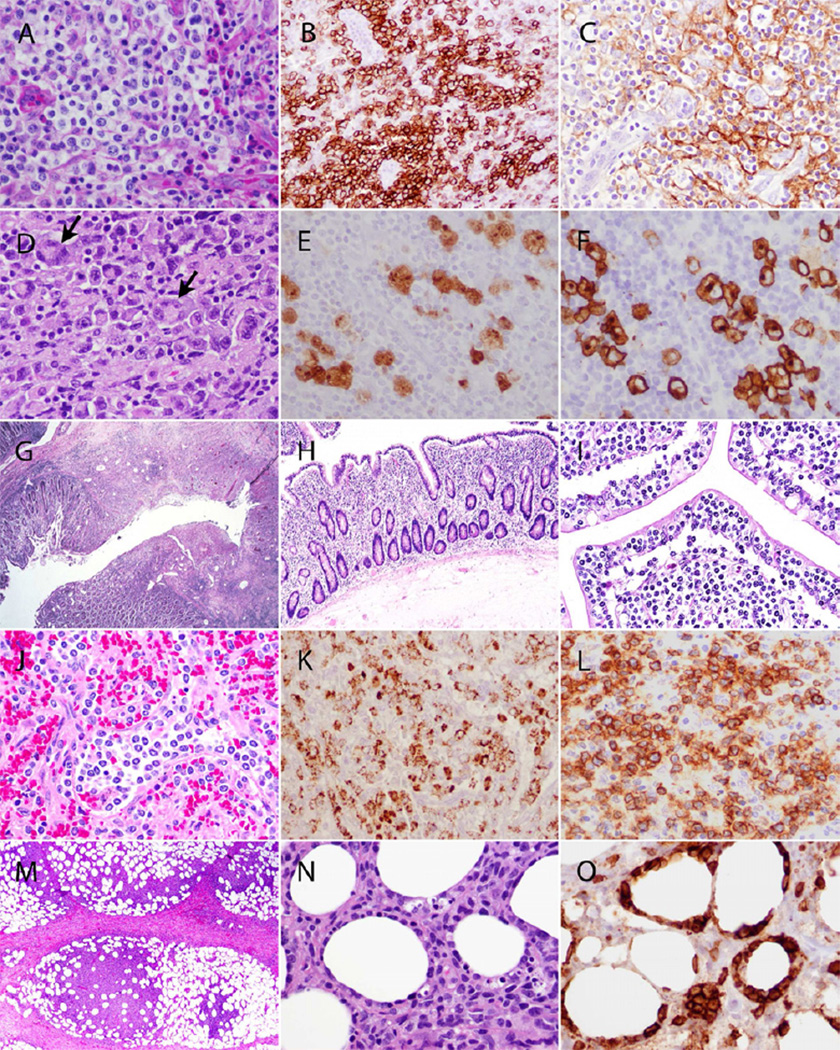
Figure 1. Pathological spectrum of T-cell lymphomas.
(A–C) Angioimmunoblastic T-cell lymphoma, lymph node. A. H&E stained section shows prominent clusters of atypical lymphocytes with clear cytoplasm surrounding the HEV. B. PD-1 positivity within the neoplastic cells clustered around the HEV. C. CD21 immunohistochemical stain demonstrating expanded perivascular FDC meshworks .
(D–F) Anaplastic large cell lymphoma, ALK positive, lymph node. D. Characteristic “hallmark” cells (examples indicated by arrows) with eccentric horseshoe-shaped nuclei and prominent perinuclear eosinophilic Golgi regions. E. Cytoplasmic and nuclear ALK expression in the neoplastic cells. F. Strong CD30 expression with a membranous and perinuclear dot-like staining pattern (highlighting Golgi region).
(G–I) Enteropathy-associated T-cell lymphoma, Types I and II, small intestine. G. EATL, type I. Low-power view of small intestinal lesion with a penetraing mucosal ulcer. Atypical lymphoid cells infiltrate the intestinal wall. H. EATL, Type I. Adjacent mucosa shows marked villous blunting. I. EATL, Type II. There is marked infiltration of the mucosa by monomorphic medium-sized cells with clear cytoplasm.
(J–L) Hepatosplenic T-cell lymphoma, spleen. J. H&E stained section of spleen demonstrating red pulp involvement by monotonous population of neoplastic cells. K. TIA-1 positivity within the neoplastic cells. L. The neoplastic cells express the T-cell receptor gamma chain, indicating a gamma-delta phenotype.
(M–O) Subcutaneous panniculitis-like T-cell lymphoma, skin. M. Subcutaneous tissue involvement predominantly affecting the fat lobules with sparing of the septa. N. High-power view demonstrating rimming of the individual fat cells by neoplastic cells. O. Neoplastic cells surrounding the fat cells are strongly CD8 positive.

